
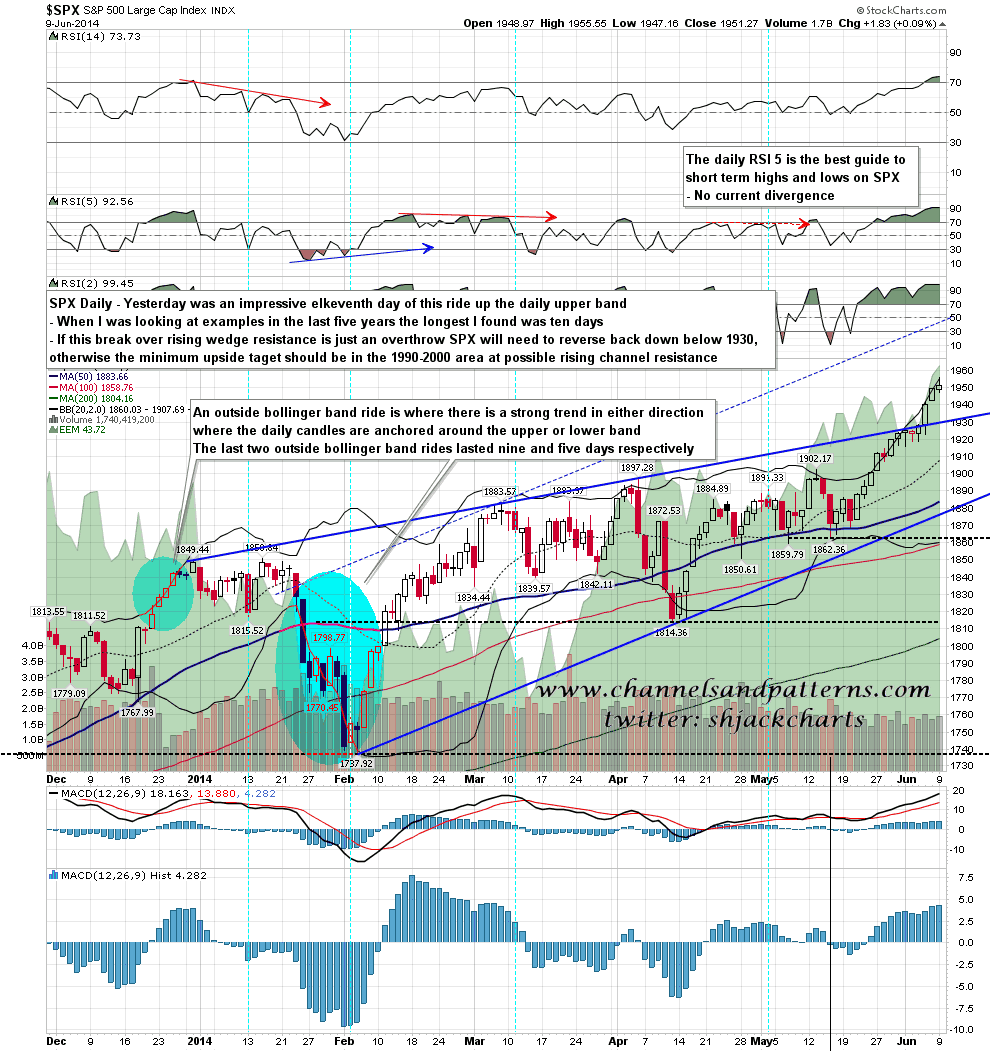
When I looked at daily upper bollinger band rides a few days ago, I found twenty six examples in the last five years. The longest of those was ten days and there was only one of those. Yesterday was the eleventh day of the current daily upper band ride, so this band ride has already beaten the actuarial odds by quite a margin. Will it reverse today? Maybe, the overnight low was low than the Sunday night low, and that is a start at least.
SPX broke over resistance on the rising wedge from 1737 last week and while this may still be a bearish overthrow, SPX would need to break back below broken wedge resistance (1930 area) in the near future. Alternatively the wedge may be evolving into a channel, but in that case I would expect to see at least a test of 2000. SPX daily chart:
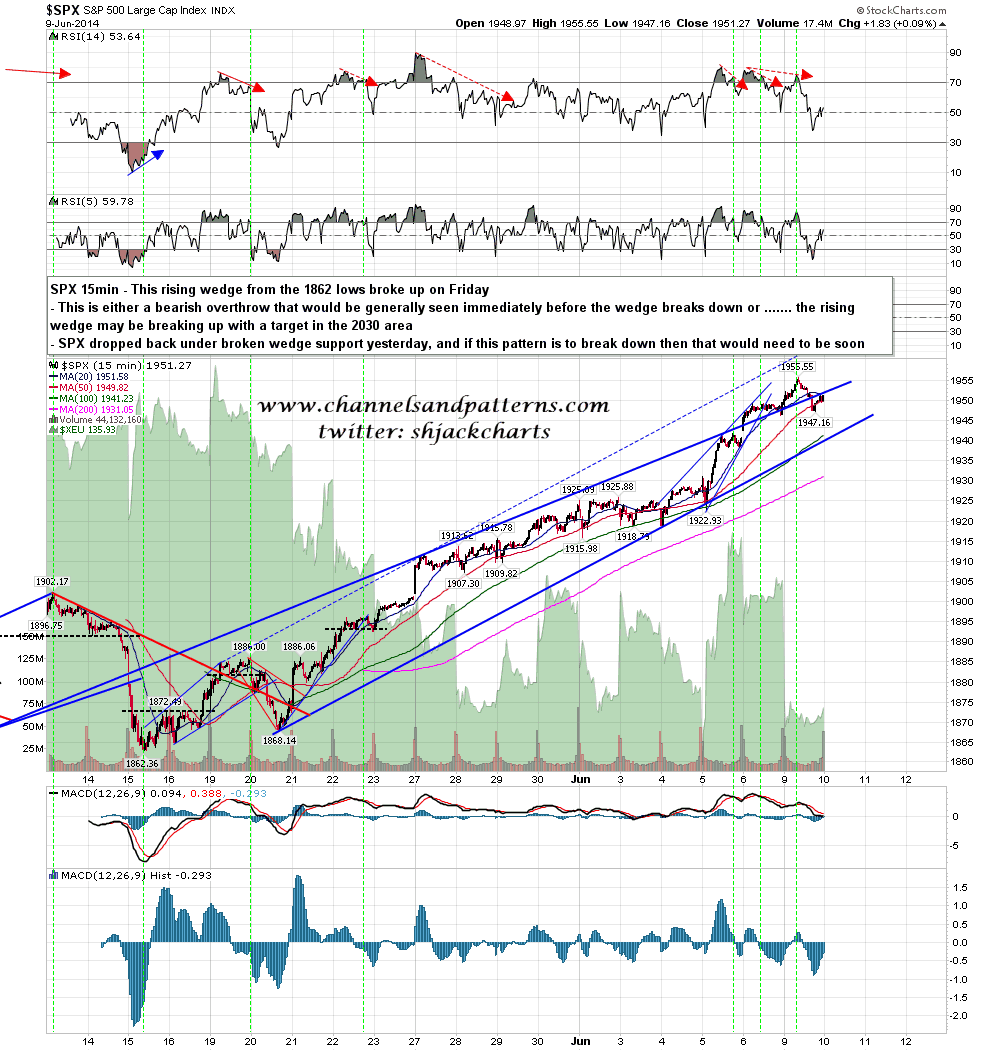
The smaller rising wedge from the 1862 area low has also broken up, and dropped back below broken wedge resistance yesterday afternoon. If that could break down now the short term technical prospects for bears would improve considerably. SPX 15min chart:
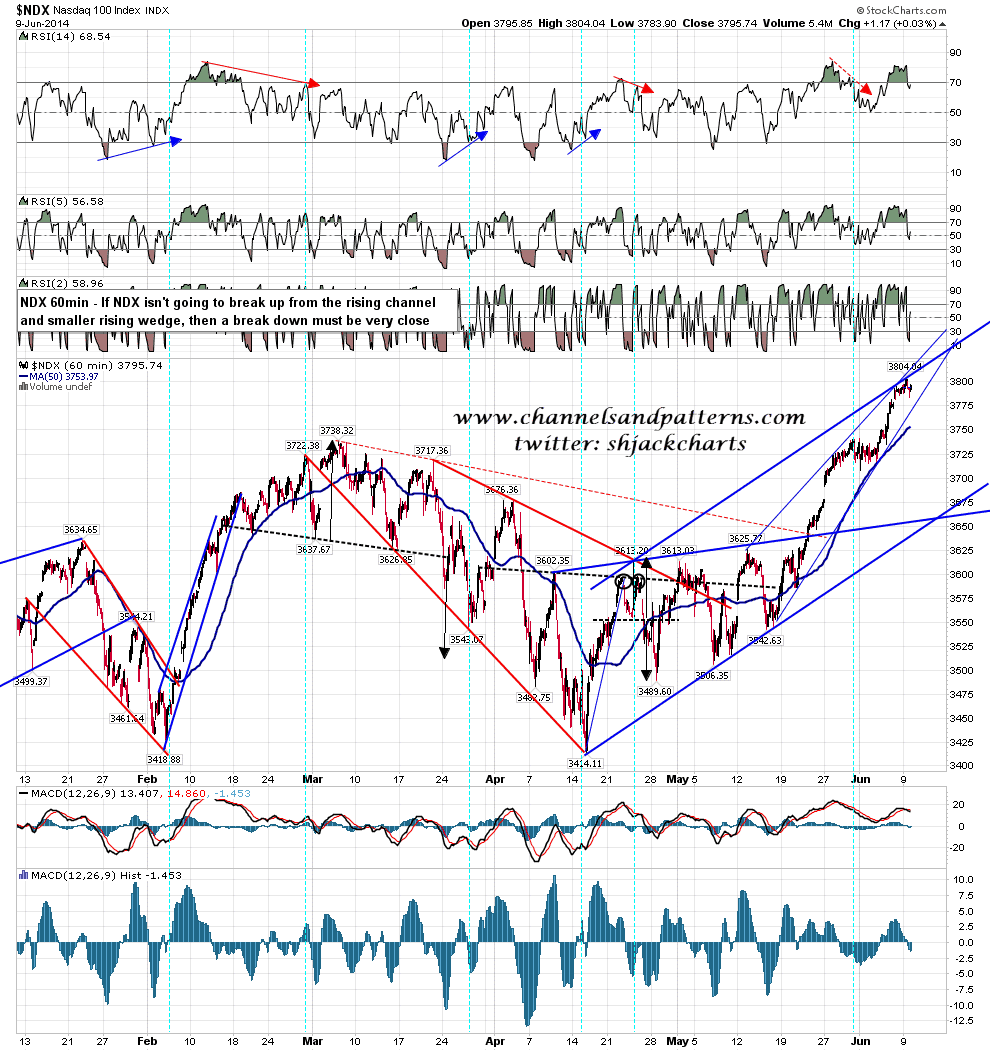
Resistance on the rising channel and smaller rising wedge on NDX is holding well and unless this is going to break up, a decent retracement should start any time now. NDX 60min chart:
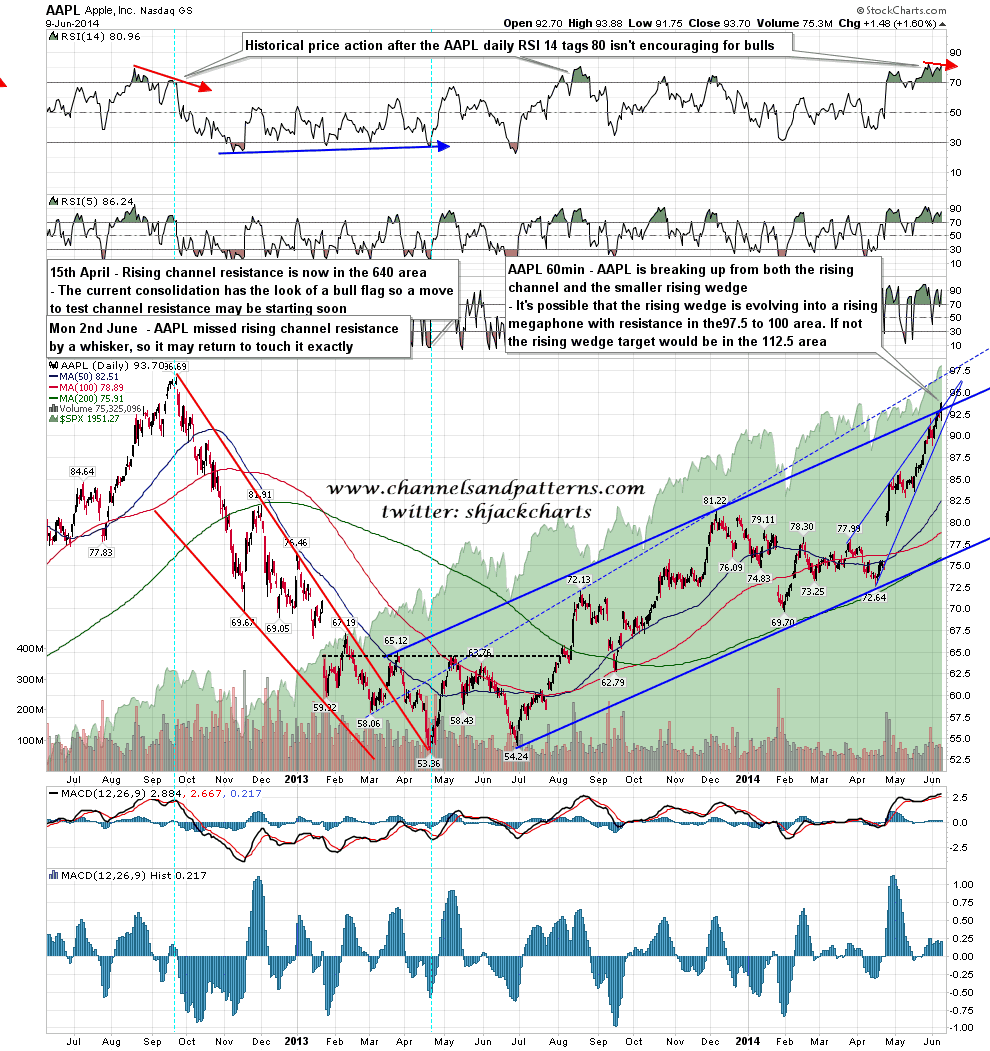
AAPL broke up from both the rising channel and smaller rising wedge there. This increases the chances that NDX will follow suit, but I’d still lean bearish on the NDX setup on balance. AAPL daily chart:
The best chart to watch for resolution on this big inflection point on bonds is the TNX chart in my view. Nothing significant has happened since yesterday morning. TNX 60min chart:

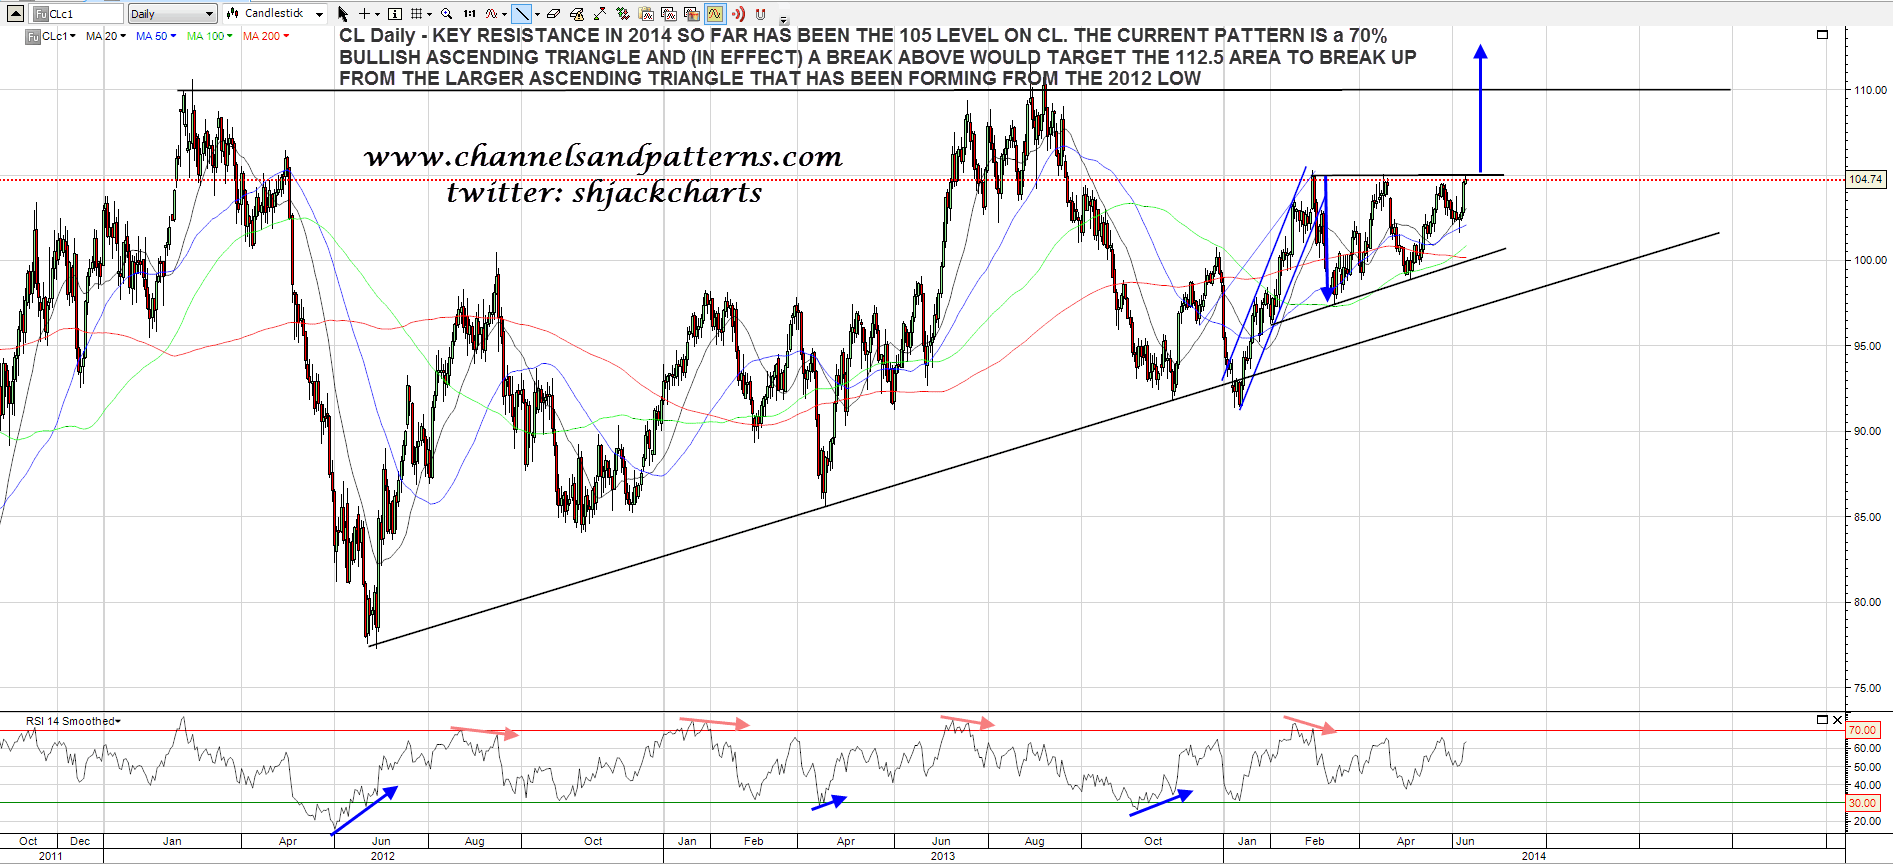
CL is back testing the 105 area, and that has been resistance all year. There is an obvious (70% bullish) ascending triangle on CL here so the odds would generally favor a break up. I’d put the odds a of a break up lower here, if only because there is an unresolved daily RSI divergence here, and these are generally very good at delivering declines on CL. At best though that would shift the odds to 50:50 in my view. CL daily chart:
Bears have a shot at breaking this huge run on SPX today. I’ll be watching the setups on the SPX 15min and NDX 60min charts with particular interest, and I would mention that in the event that we do see a strong decline here, we may well nonetheless see the highs retested before any decline below 1900 could be attempted.
