Here is today’s swing-trading watch-list:
Long VMware (VMW)

Slope initially began as a blog, so this is where most of the website’s content resides. Here we have tens of thousands of posts dating back over a decade. These are listed in reverse chronological order. Click on any category icon below to see posts tagged with that particular subject, or click on a word in the category cloud on the right side of the screen for more specific choices.
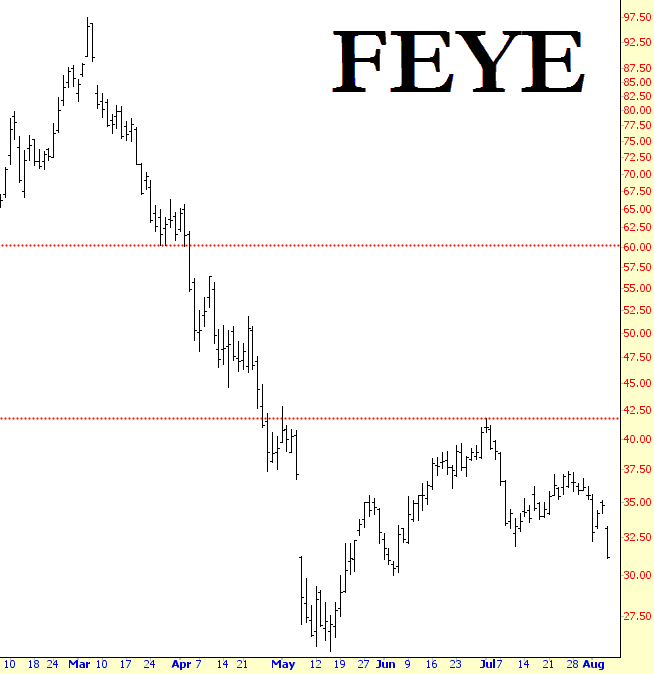
I’ve read enough bad-mouthing about FireEye on Slope to take an interest in it, so two days ago, I shorted a meaningful amount. I knew earnings were coming up, and I was a little chagrined to see the stock pop up over 2% after hours Tuesday evening. Well, my concerns were unnecessary, as the chart reveals.. We are now in a market where piece o’crap stocks are actually allowed to keep plunging. (UPDATE: I wrote this post twenty-four hours ago, so it’s even less germane now, but all the same, I like the way this stock looks on the short side).
My chart looks different below (since I’m downstairs at my luxurious hotel with the most non-luxurious Internet speed you can imagine…..so I’ve hotwired to their line instead of using wireless) since I’m on my Macintosh. Anyway, as many years as I’ve been doing this, and as many hundreds of thousands (literally) of charts I’ve examined, I still can be dazzled by the amazing relationships the simplest lines can reveal on a chart. Below is Alcoa (symbol AA) – – take note of the astonishing nature of support/resistance, even over the course of a decade, and even over the course of several business cycles. Wow! (more…)
Yesterday was cautiously promising for a reversal at the inflection point here. The two lows this week are at 1913 and 1911, both in the 1911-14 strong support target area that I was looking at on Friday morning. We have a possible double bottom in place if the decline patterns can be broken. If the decline patterns can’t be broken then yesterday was day five of the daily lower band ride and it could run down longer and further. SPX daily chart:
