
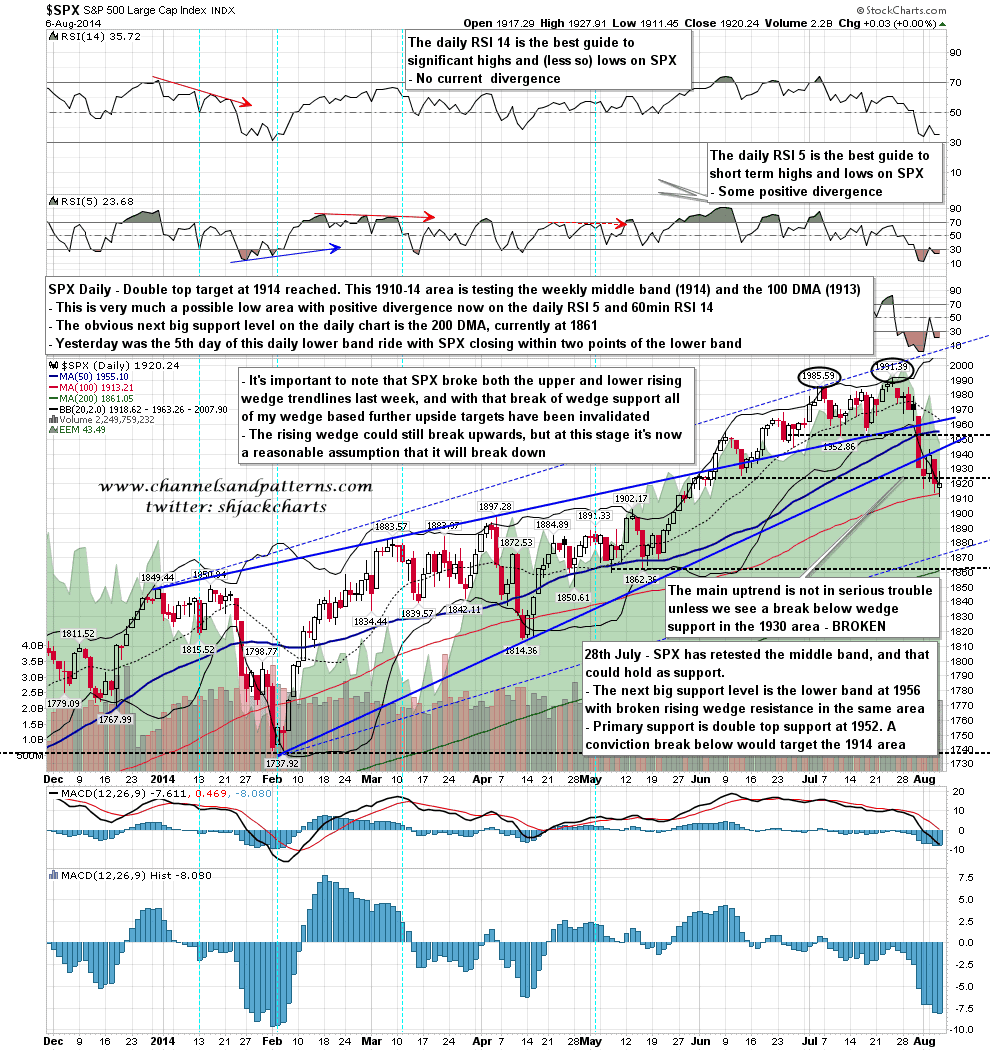
Yesterday was cautiously promising for a reversal at the inflection point here. The two lows this week are at 1913 and 1911, both in the 1911-14 strong support target area that I was looking at on Friday morning. We have a possible double bottom in place if the decline patterns can be broken. If the decline patterns can’t be broken then yesterday was day five of the daily lower band ride and it could run down longer and further. SPX daily chart:
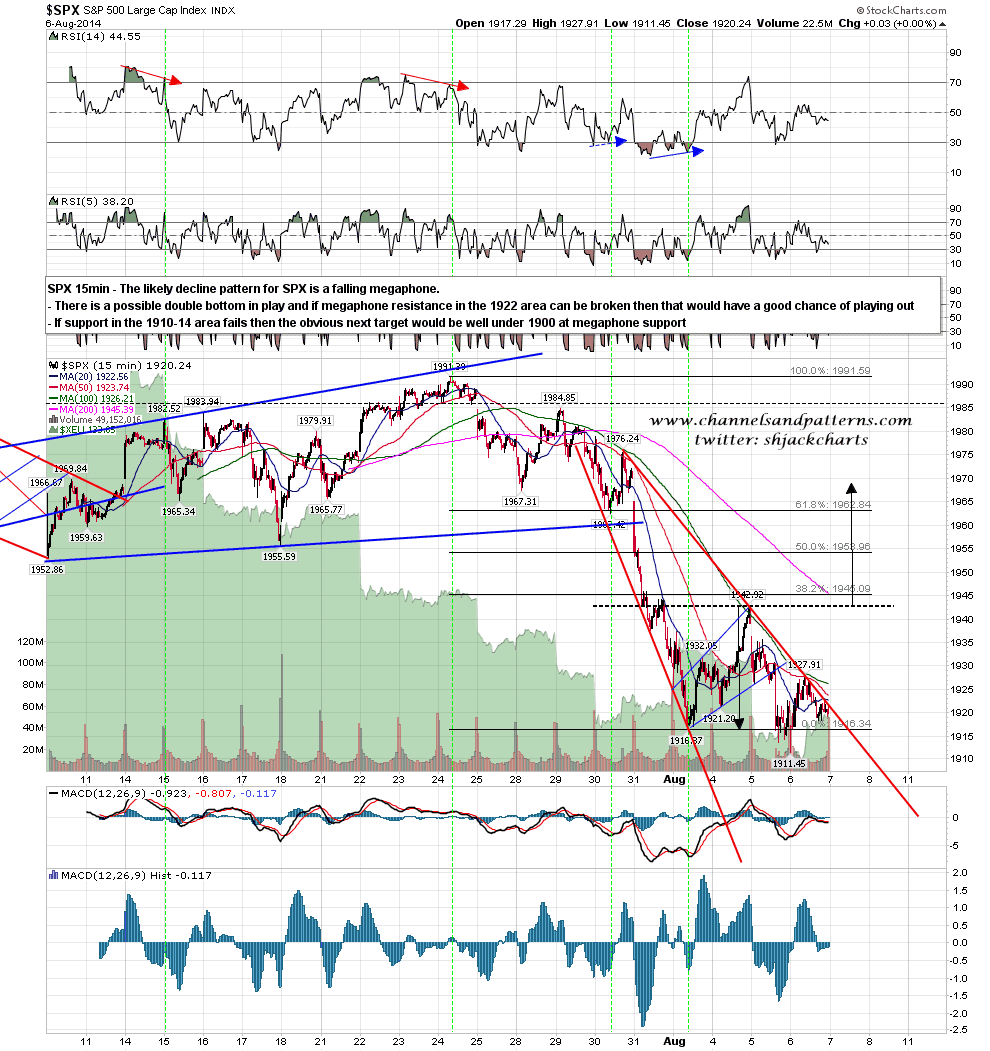
Bulls had a shot at breaking the falling megaphone on SPX yesterday and strengthened the resistance trendline with a third touch. If that breaks then yesterday’s low should be good and I’d be looking for a test of Monday’s high at 1942 SPX and double bottom resistance there. SPX 15min chart:
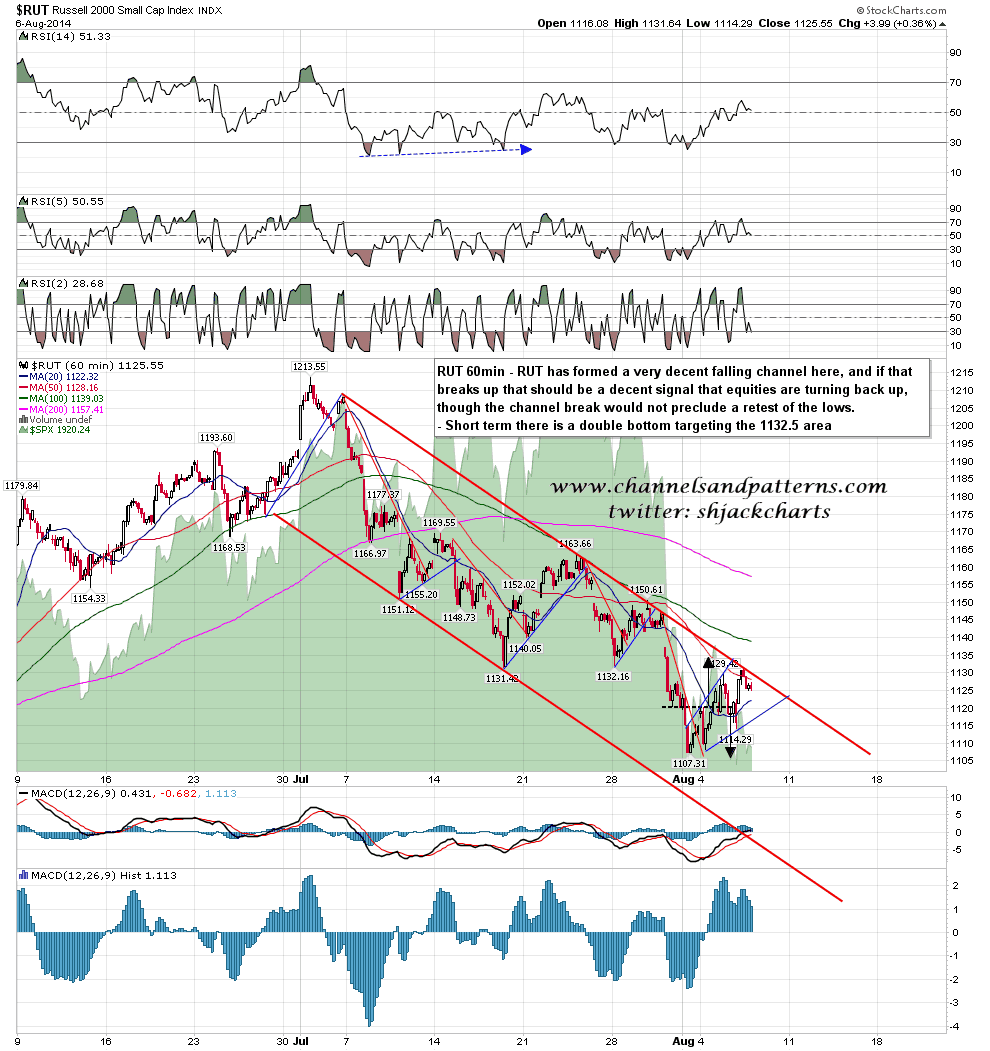
Falling channel resistance was also tested on RUT, and again the resistance trendline was strengthened. A break above today should be good and there is a possible reversal pattern in play here on RUT already with an upsloping IHS. Having these reversal patterns in place already on SPX and RUT means that if we do see a break up, a subsequent retest of the lows is less likely. RUT 60min chart:
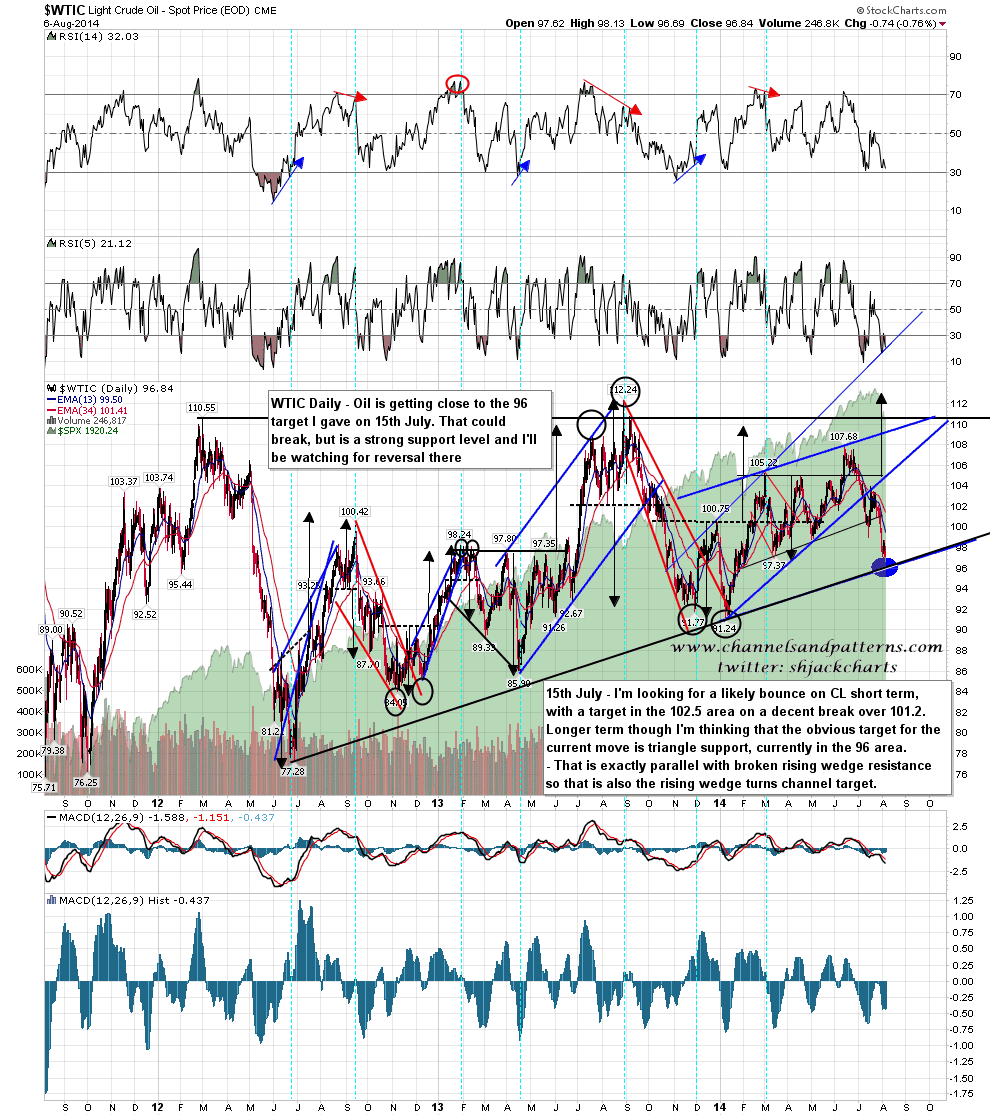
Oil is inching closer to my 96 target. We could well see a big reversal there and I’m watching this carefully. WTIC daily chart:
So what if the patterns do break up today and yesterday’s low is good. Well at that stage there are two main options. The first is that SPX bounces to test the 50 DMA at 1955 area. If a major high is already in place then that would be the likely option. the second (and my preferred option) would be that SPX would rally to new highs. I’ve mentioned regularly before that big highs are generally preceded by a big spike downwards that is recovered soon afterwards. This is by way of being a practice run. This outcome would be supported by a break over the possible double bottom resistance at 1942, as the double bottom target would be the 1973 area. As ever time will tell.
