[edit] Simple chart update turns opinionated [separate the two, as needed]… and the title is changed from ‘US Stock Market’ to reflect said opinions.
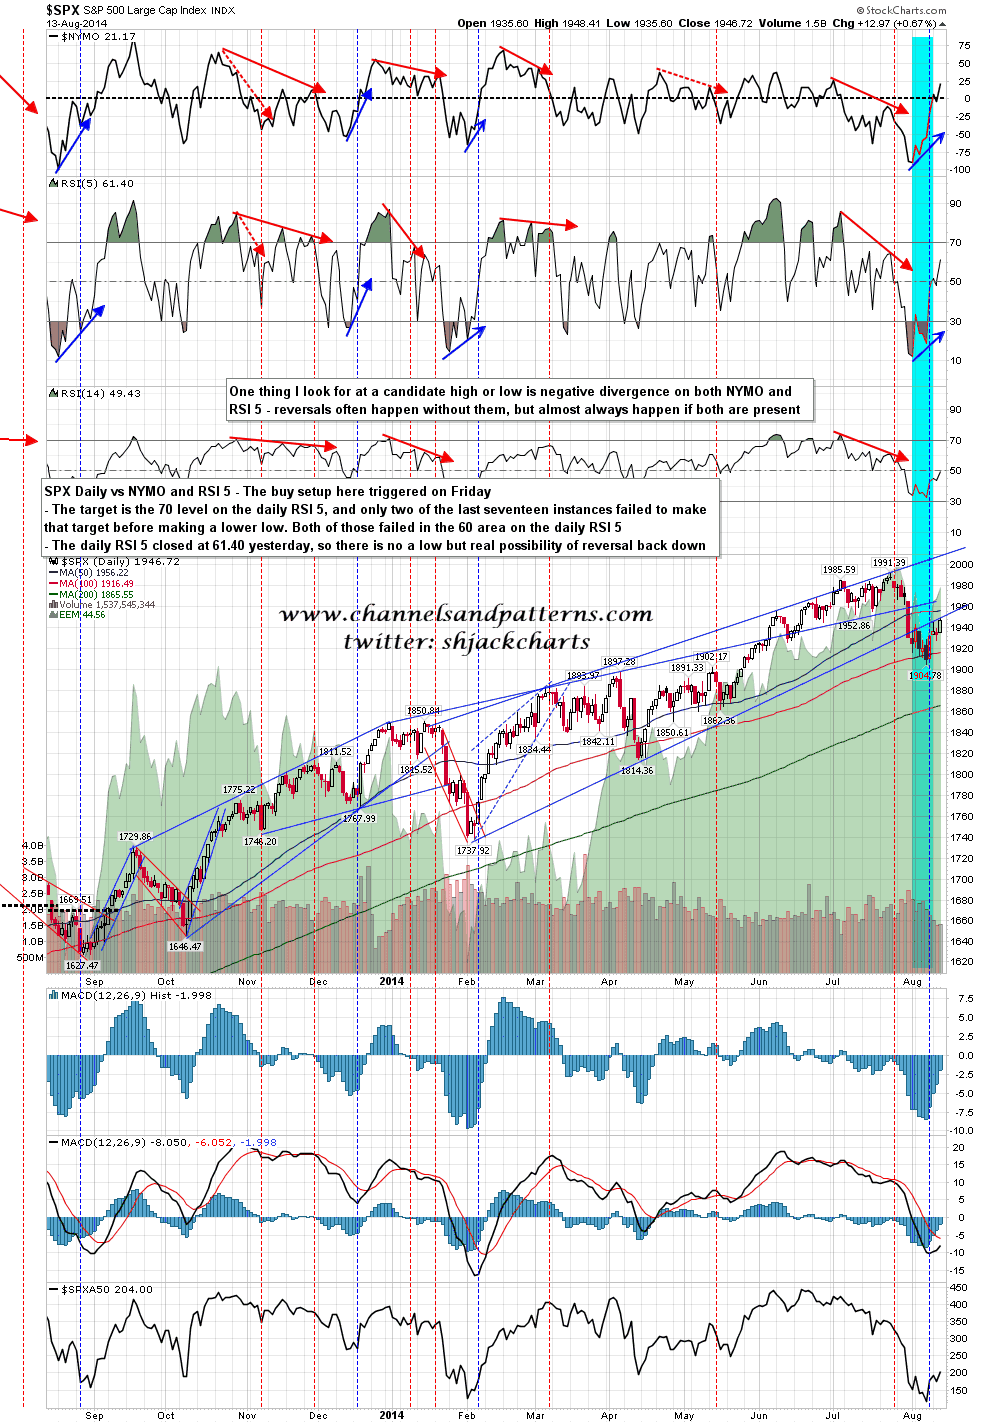
The first chart shows the progress the SPX is making on our 60 minute view. It turned up above the support level noted a couple days ago and is now logically dwelling at the pattern neckline. This is still bullish obviously, having made a higher high. Resistance and the measured target (blue arrow) are noted.