
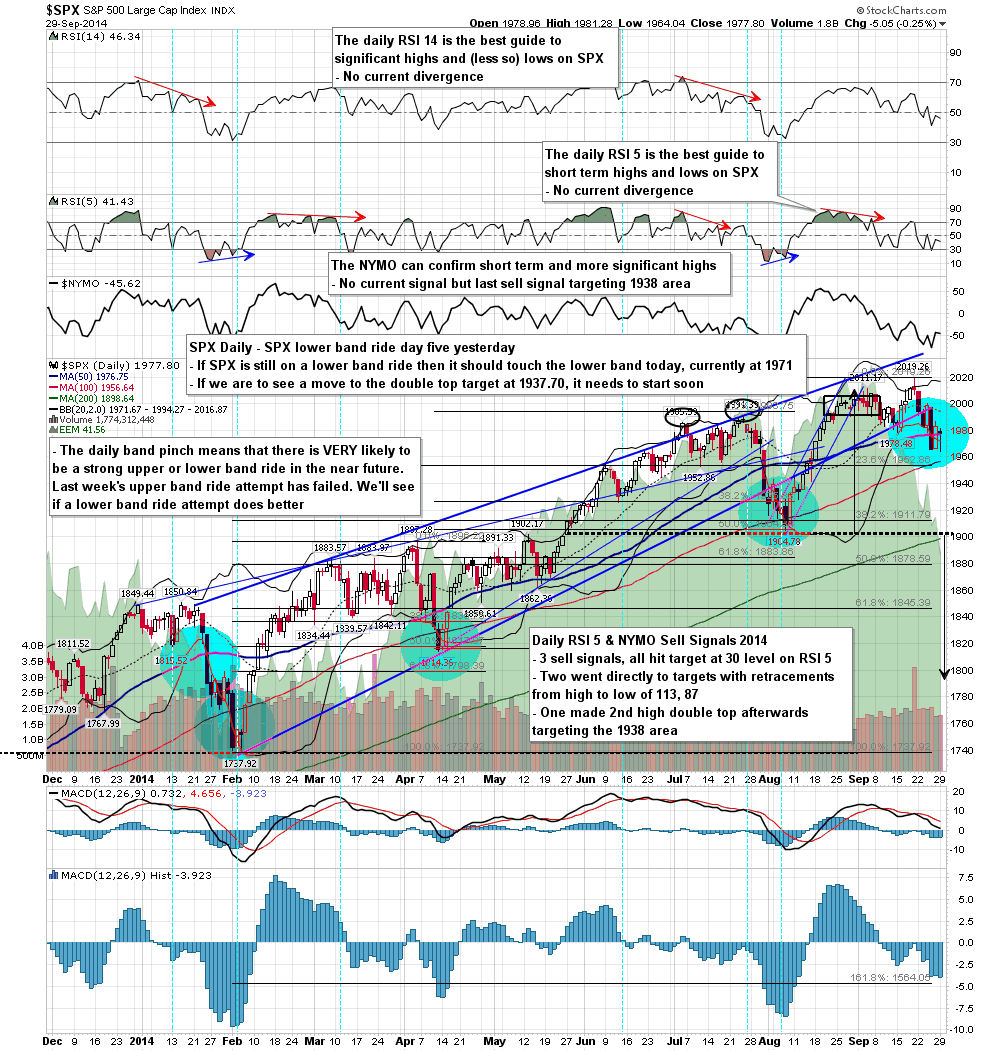
Another whippy day yesterday, but one that, unlike the more superficially bullish Wednesday and Friday rallies last week, leaves the bulls in a very good position for a break up today. The daily lower band was tested in the morning, so that was either day three or day five of this sideways lower band ride, depending on how the second day with tests of both lower and middle bands is counted. The candle was a 60% bullish reversal hammer, and there are now possible bottoming setups across all the main US equity indices as well as some broken declining resistance trendlines. SPX daily chart:
Now one thing that I dislike seeing when I have open downside targets is a marginal new low that is strongly rejected. There was one yesterday of those on SPX (and NYA and WLSH). That has set up a possible double bottom that would target the 2008.50 area on a sustained break over Friday’s high at 1986.27. That level is the centre of a resistance zone that starts with falling megaphone resistance in the 1985 area, continues with double bottom resistance at 1986.27, and ends with the 50 hour MA at 1987.74. if we see a break over the 50 hour MA that will be a break that should be respected, though if bulls want to make the full double bottom target they will also of course need to take out the daily middle band, currently at 1994. SPX 60min chart:
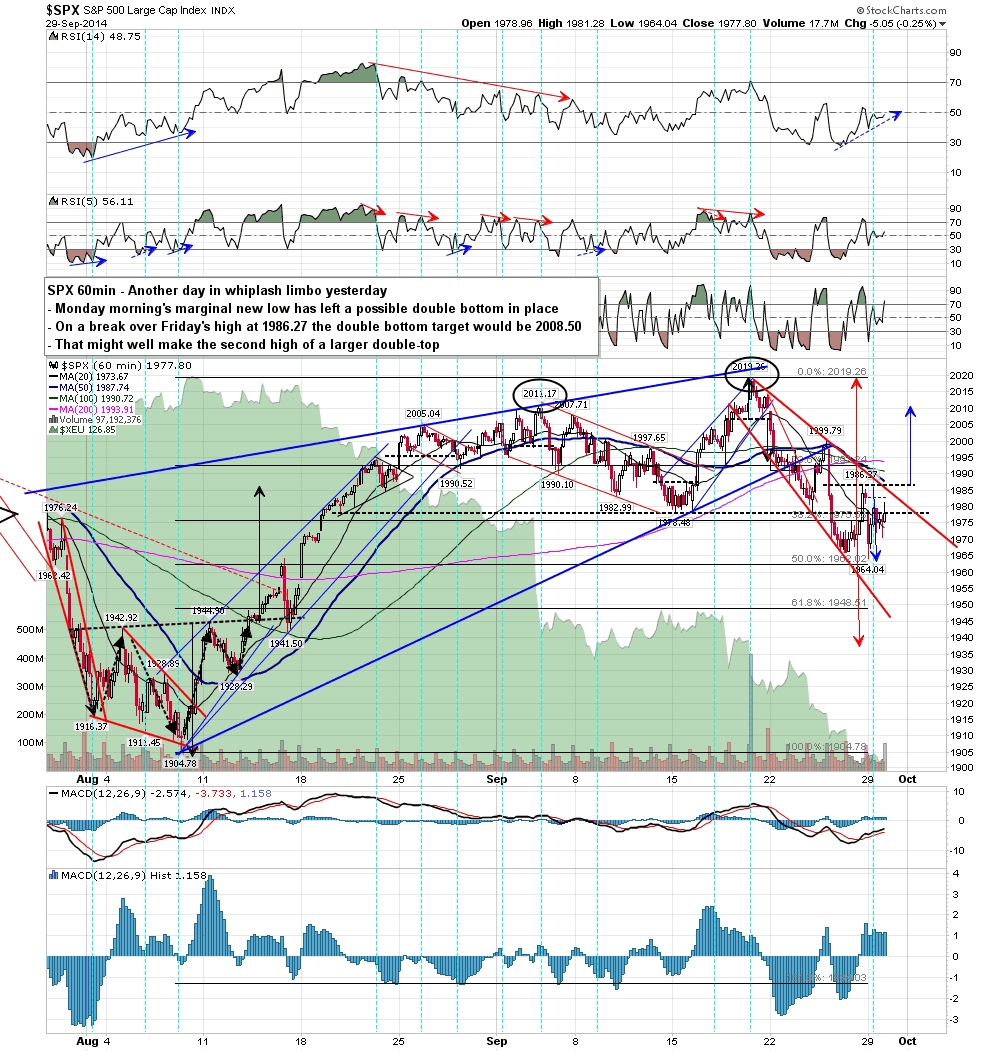
At the close yesterday declining resistance from the high (or last significant high on RUT and NYA) was not yet broken on SPX, Dow, NDX and NYA. It has already however been broken on TRAN, RUT and WLSH, so I’ll be looking at those next.
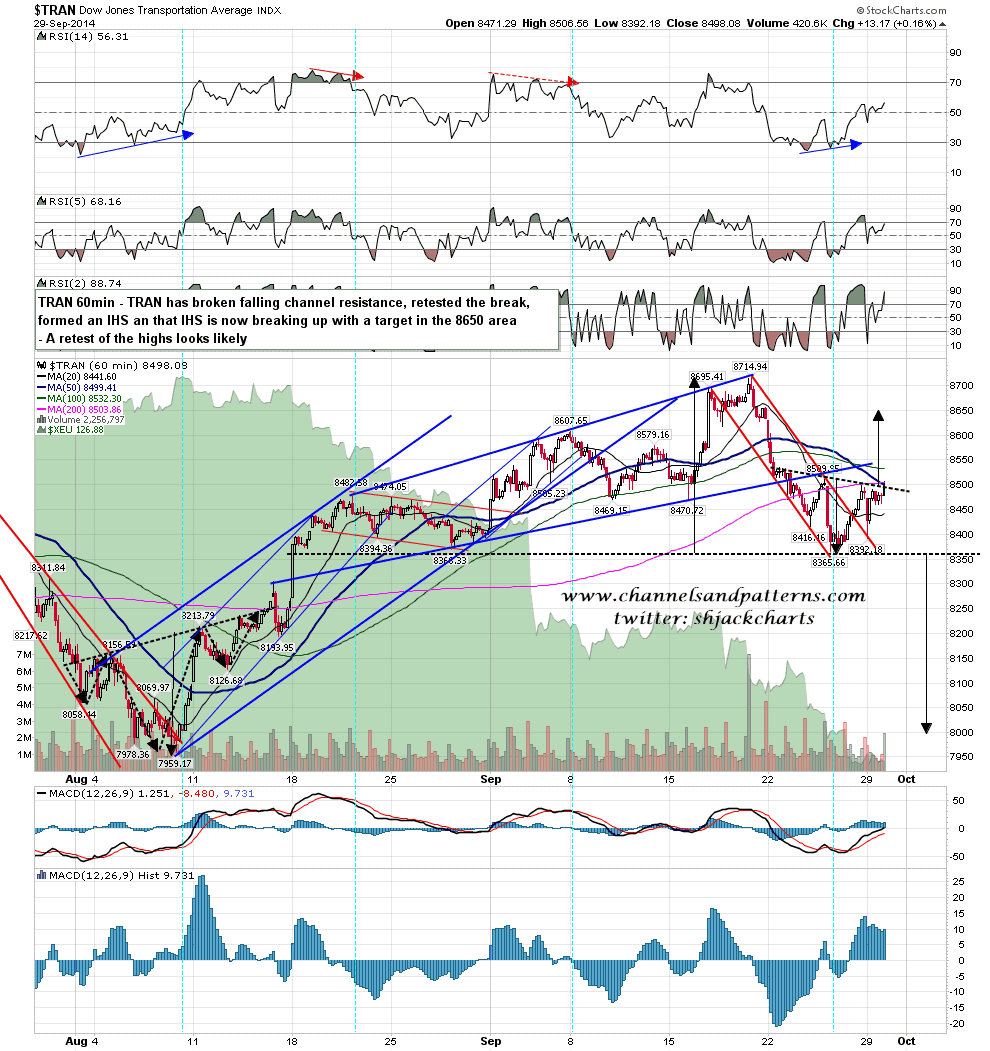
On TRAN falling channel resistance has been broken, retested, and a downsloping IHS has formed and broke up yesterday afternoon. The IHS target is the 8650 area, close to a retest of the highs. TRAN 60min chart:
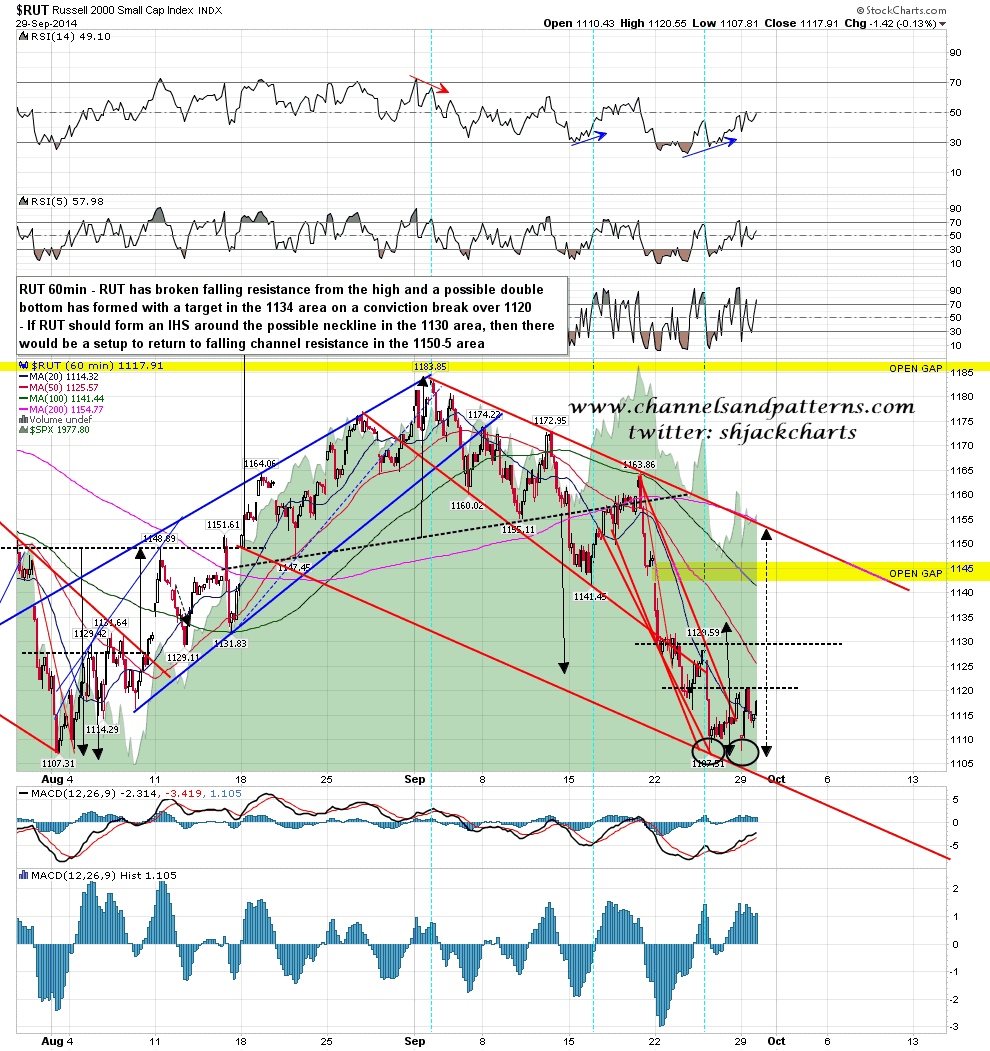
On RUT the falling channel or wedge has broken up, retested, and a double bottom has formed with a target in the 1134 area on a break over 1120. There is also a possible IHS neckline in the 1130 area and an IHS could form there to take RUT back to falling channel resistance in the 1150-3 area. RUT 60min chart:
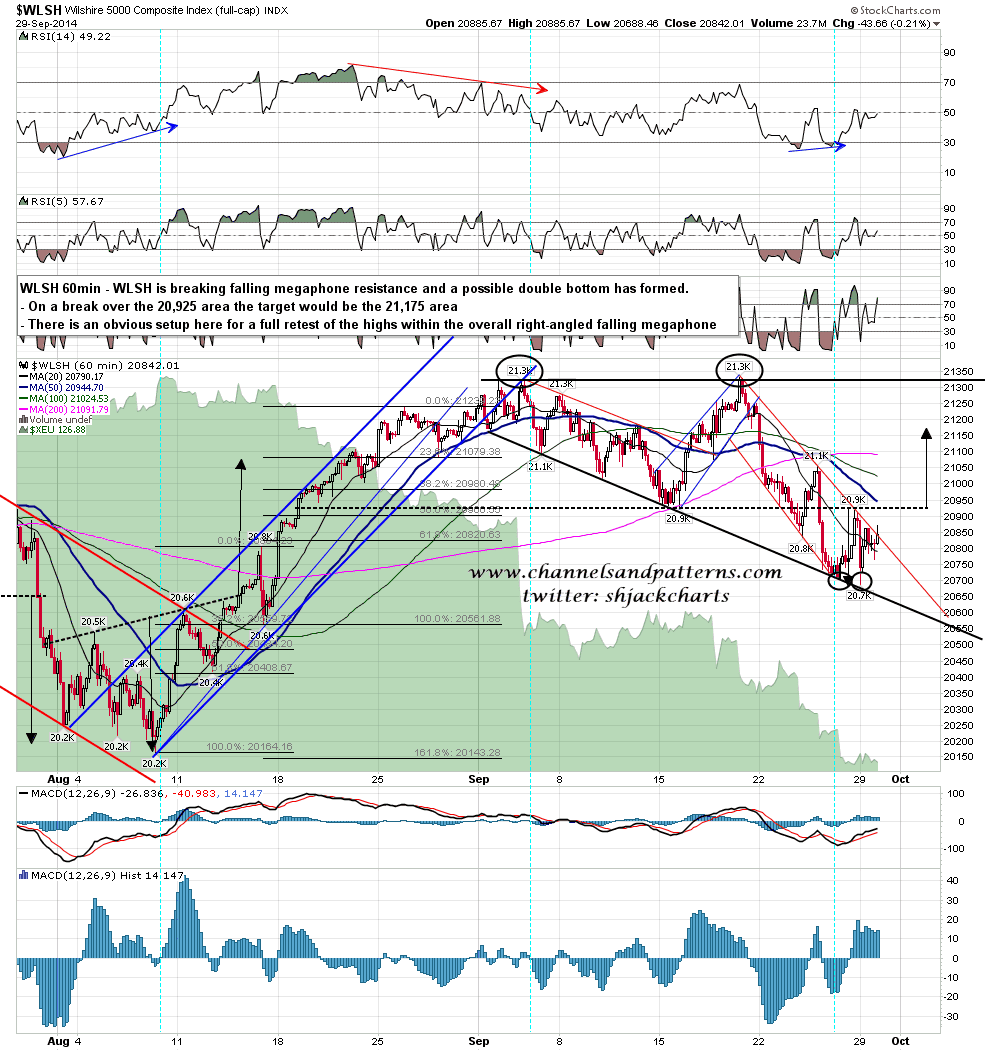
WLSH was breaking up from the falling megaphone there yesterday afternoon and another possible double bottom has formed there. On a break over the 20,295 area the target would be the 21,175 area, though as with RUT there is a possible IHS neckline in the 21,050 area that may deliver an IHS and a target back at the highs. Given the right-angled falling megaphone on WLSH there is a decent argument for a retest of the highs in any case. WLSH 60min chart:
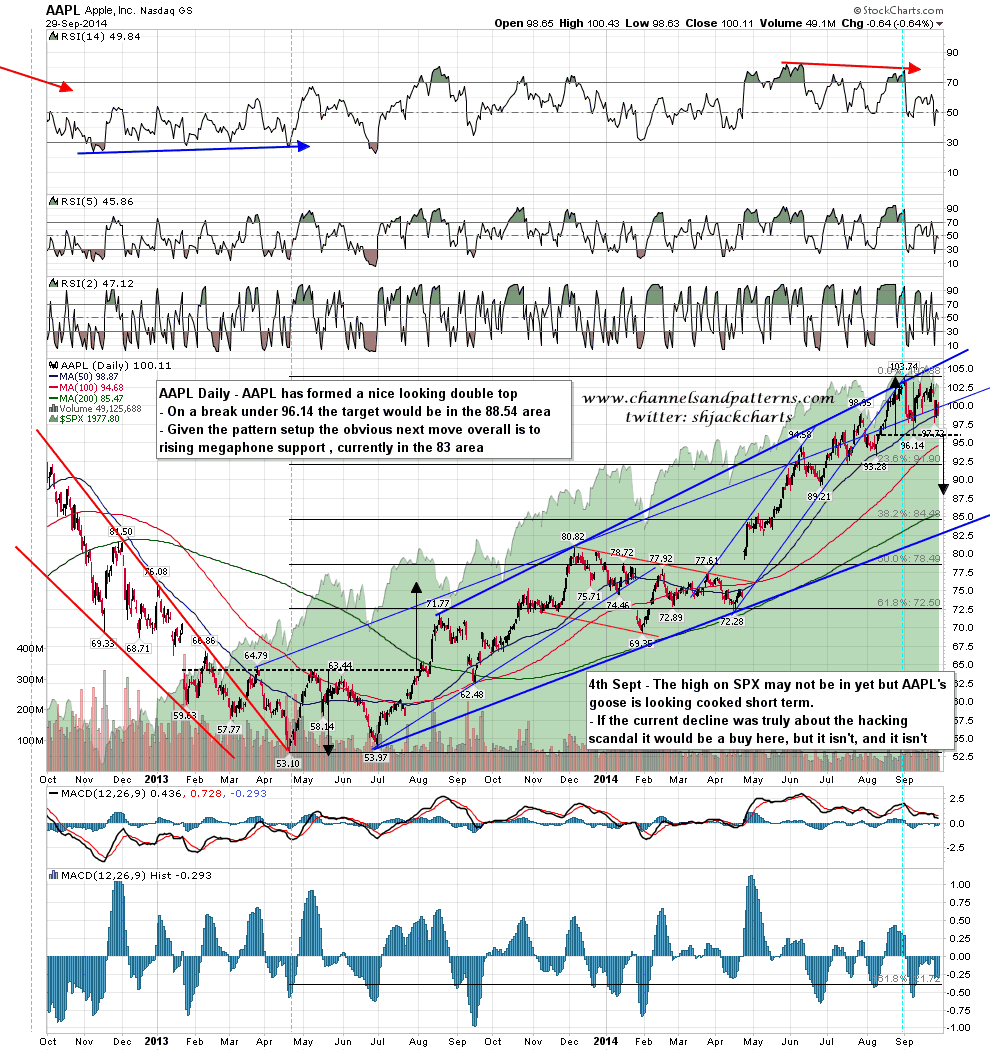
I was asked to look at the AAPL chart yesterday and not much has changed since I looked at this at the start of September. A double top is forming that would target the 88.54 area on a break under 96.14. The obvious bigger picture target would be a test of rising megaphone support, currently in the 82.5 area. AAPL daily chart:
It may be that falling megaphone resistance will hold at the (likely) test today and that the double-top on SPX will then make the 1937.70 target. However almost everything about the setup forming since that double-top broke down last week is suggesting strongly that this particular pattern is going to fail. That is unusual on a double-top (or bottom) that has made it halfway to target, and is mostly seen when a larger reversal pattern is forming. My working assumption if we see a break up today would therefore be that SPX is about to make the second high of a larger double top. That might involve a higher high, though I’d prefer a failure short of the high.
A larger double-top would make technical sense. An issue that I have muttered about once or twice over last couple of weeks is that the current double-top targets 1937, well short of the obvious bigger picture support test at the 1904 low, leaving a substantial void between the two targets. A larger double top without a marginal new high would then target the 1909 area on a break below 1964, largely closing that gap, and a larger top with a marginal new high at (say) 2022, would close it altogether. As ever time will tell, but the bulls have a real chance today to break resistance and set up a retest of the highs, and I’m now leaning towards that scenario as being the likely outcome of the resistance test that we should see today.
