
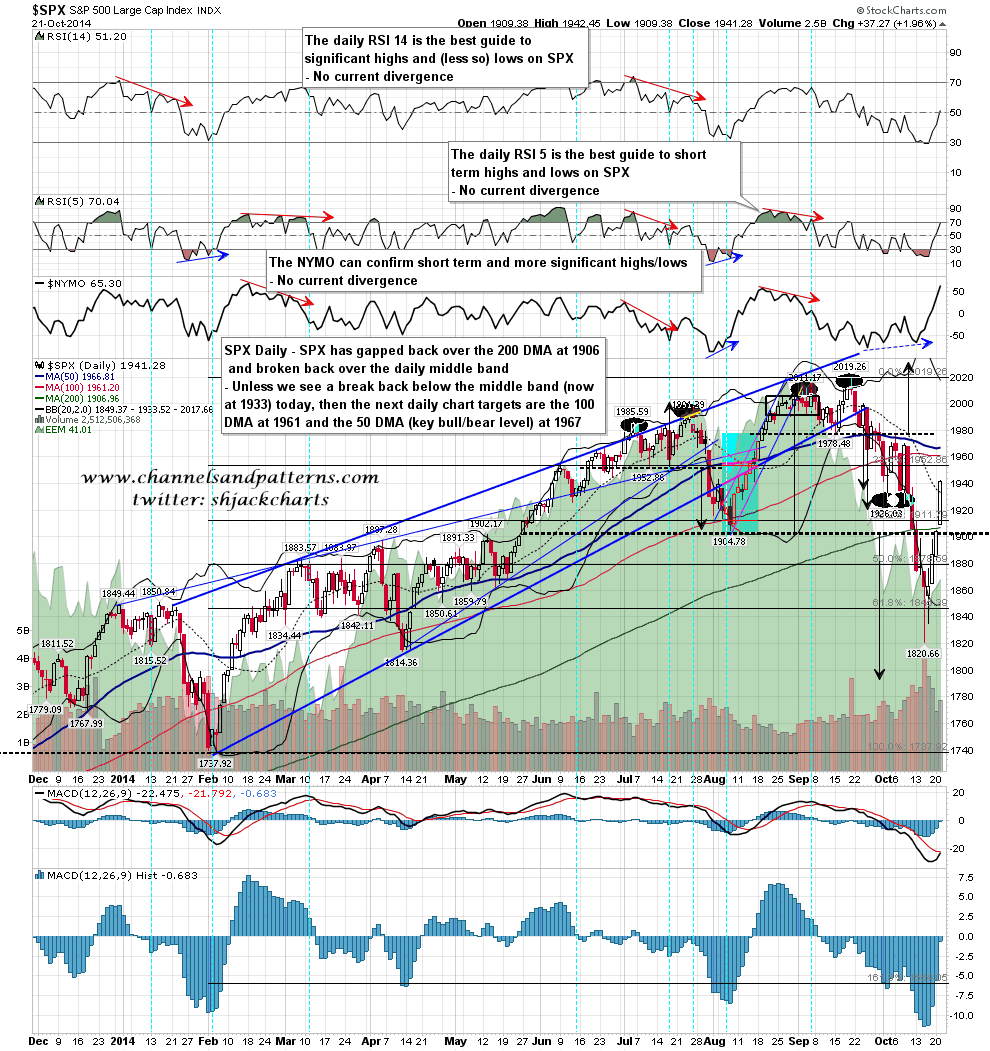
Yesterday went pretty much as I expected, except for the direction of course, which was up rather than down. There were an impressive list of bullish breaks over the course of the day, starting with the gap back over the 200 DMA, then a break over the 50% fib retracement level at 1920, the daily middle band (closed at 1933), and the day closed at the test of the 61.8% fib retracement level at 1943.
There is one more big resistance level above, and that is the very important 50 DMA at 1967, but in practical terms any sustained break over the 61.8% fib retracement level at 1943 will greatly increase the chances that the retracement low was made at 1820, and on a sustained break over the 50 DMA, there would be a clear target back at a test of the 2020 highs. SPX daily chart:
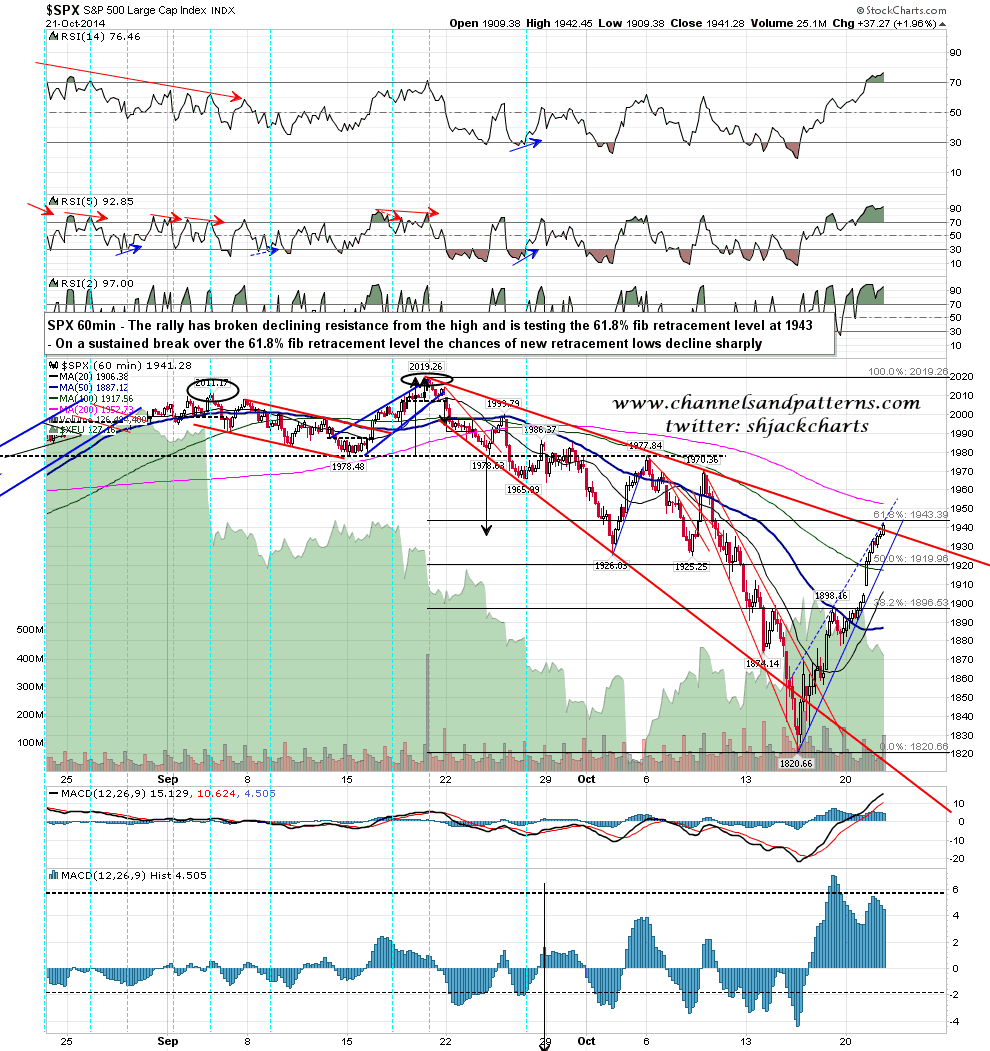
Also worth noting is that declining resistance from the highs on SPX was also broken yesterday. That’s not unusual in a B wave, but adds another significant card to the hand the bulls are holding after yesterday. My personal feeling here, backed up by the obvious (not marked up on the chart below) IHS that formed at the 1896 neckline, is that this move is targeting a test of the 50 DMA area around 1967, and that we will be seeing that test soon. SPX 60min chart:
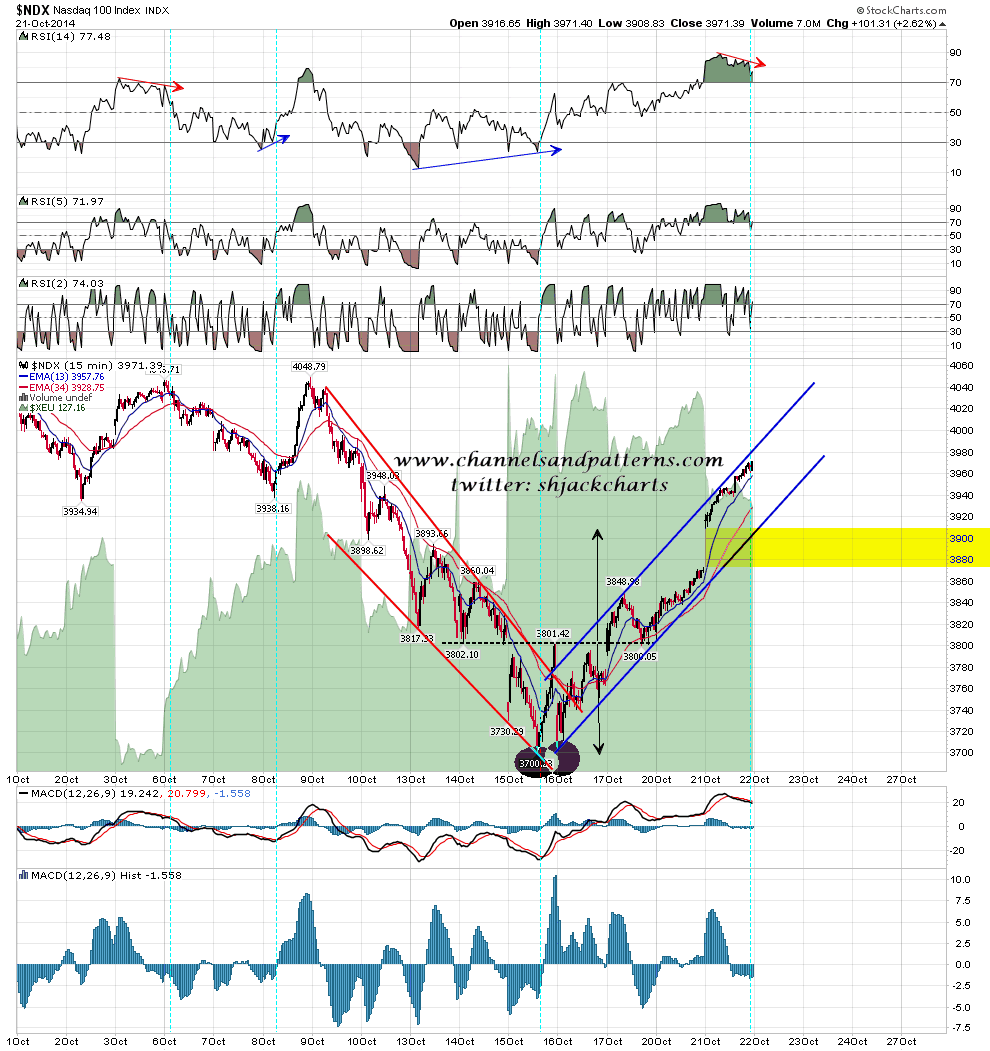
Short term however, I am watching the patterns that have formed on some major indices since the low. If we are to see any significant retracement before a test of the 50 DMA on SPX, then the first sign will be a break of the support trendlines on these patterns. Until we see those breaks there is nothing much interesting on the bear side here in the short term. I’ll be watching these and calling support breaks on twitter, though I’ll mention now that the first thing I look for on such a break is a possible retest of the high made before that break.
There is a very high quality rising channel here on NDX. NDX 15min chart:
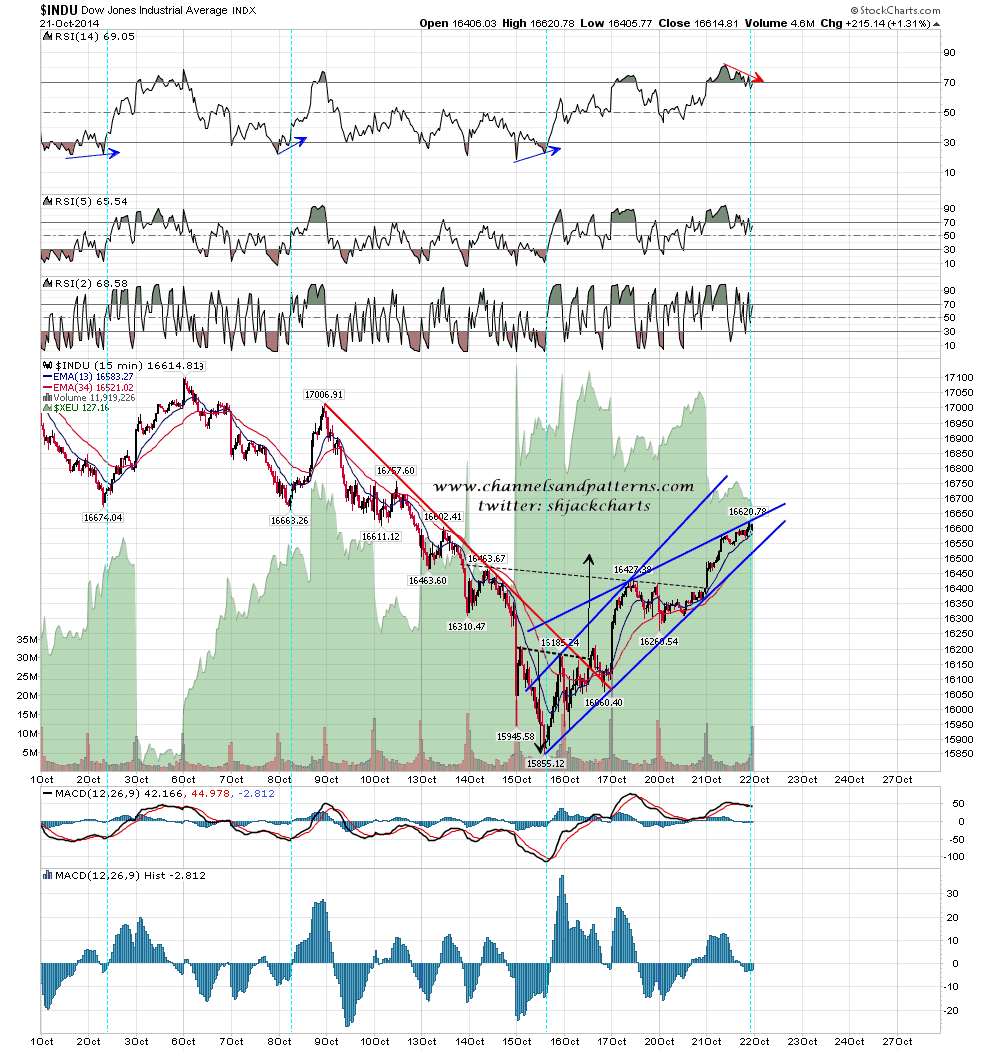
Dow is either forming a rising wedge or megaphone. I’m leaning towards a wedge but we should find out this morning. INDU 15min chart:
There is another very high quality rising channel here on TRAN. TRAN 15min chart:

In summary a test of the SPX 50 DMA in the 1967 area is looking likely in the next week or so, and that could happen as soon as today. At that point any question as to whether we are still in an overall downtrend should be answered. We may well see a sharp retracement on the way to that target, and the first sign that such a retracement might happen would be rising support breaks on the patterns I have posted above. There is a lot of negative divergence on the 15 minute RSI 14s at the close yesterday and we may well see those retracements start today. The stats lean towards consolidation or retracement today as yesterday was a trend day.
