
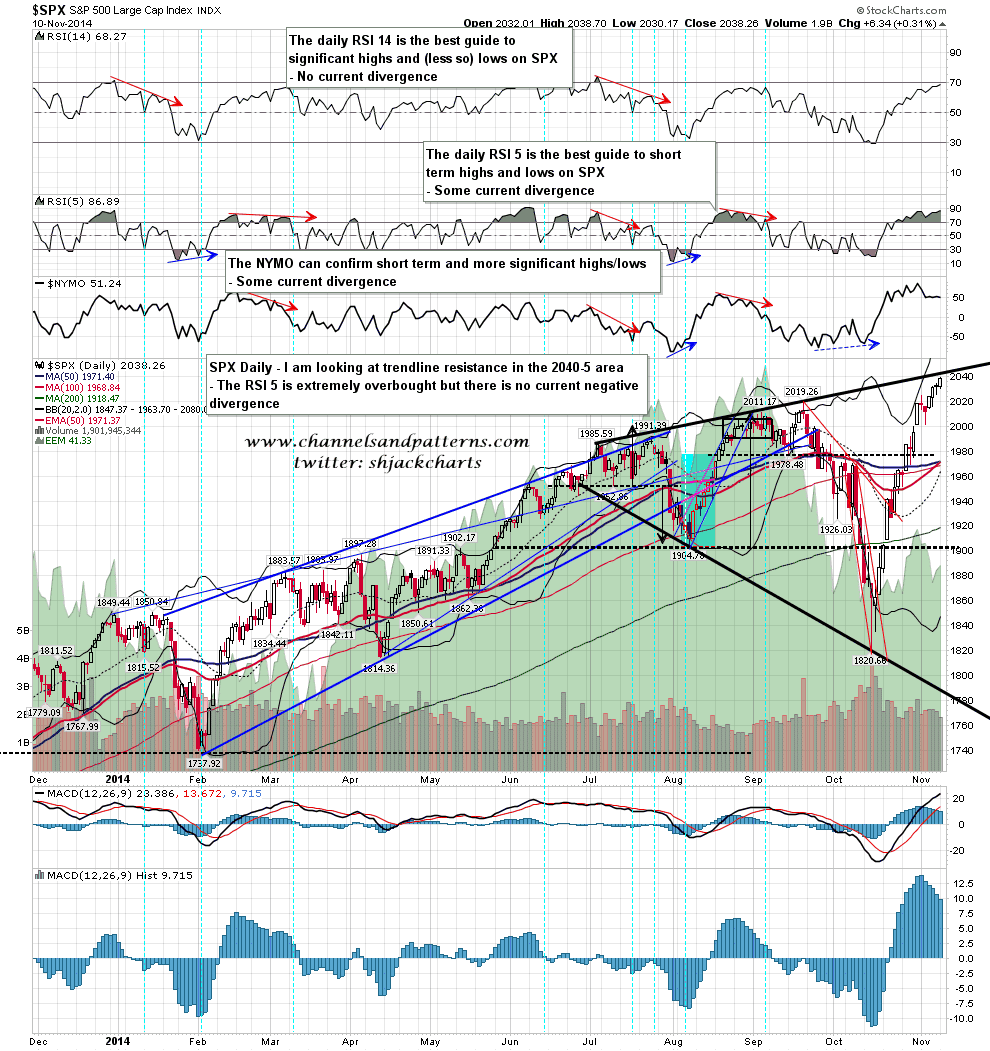
SPX made another new all time high yesterday and is now very close to a hit of my megaphone resistance trendline. I’m expecting some resistance there. The daily RSI 14 is approaching 70 and the RSI 5 is extremely overbought, though the last move up killed off the negative divergence there. SPX daily chart:
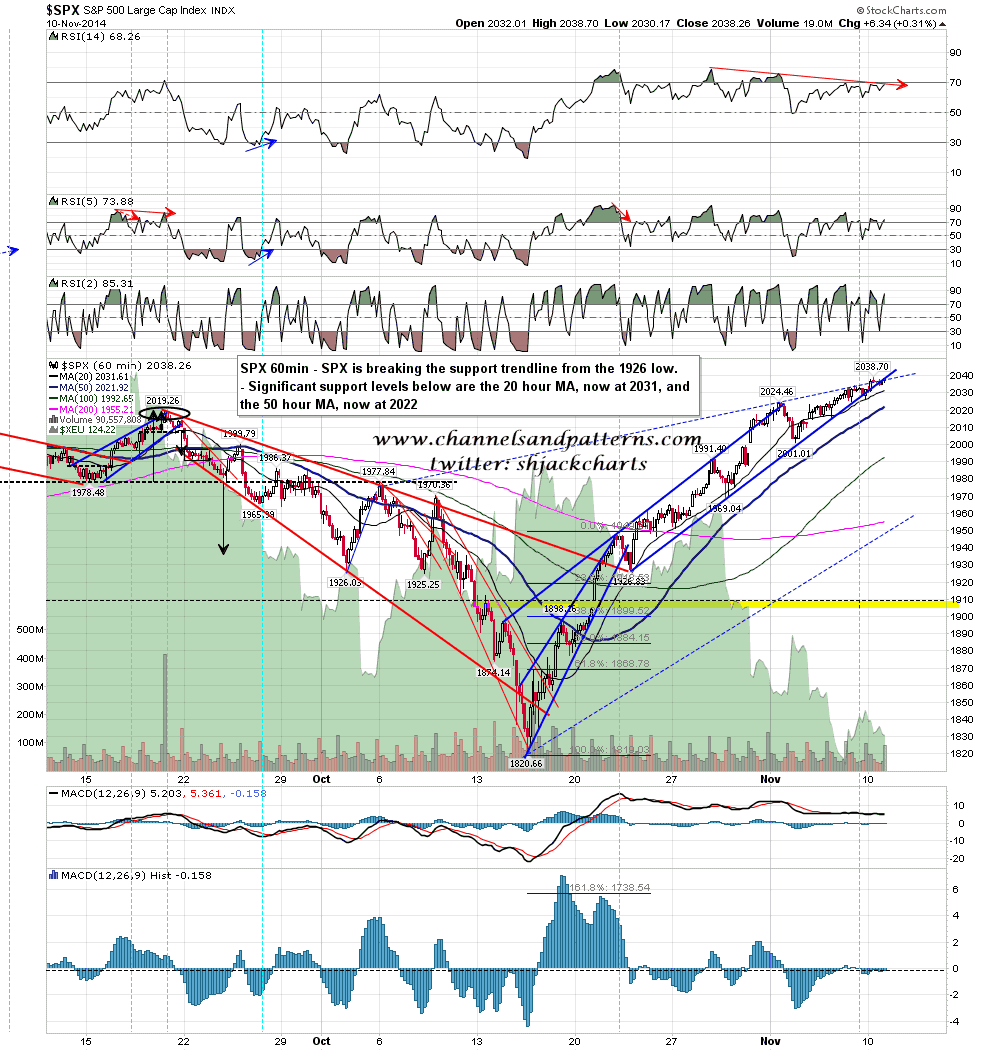
There is negative divergence across the board on the USD equity index 60min charts. SPX is breaking the support trendline from 1926 and a move below the 20 hour MA at 2031 should signal a retrace has started. Until then the chart is just suggesting retracement sometime soon. SPX 60min chart:
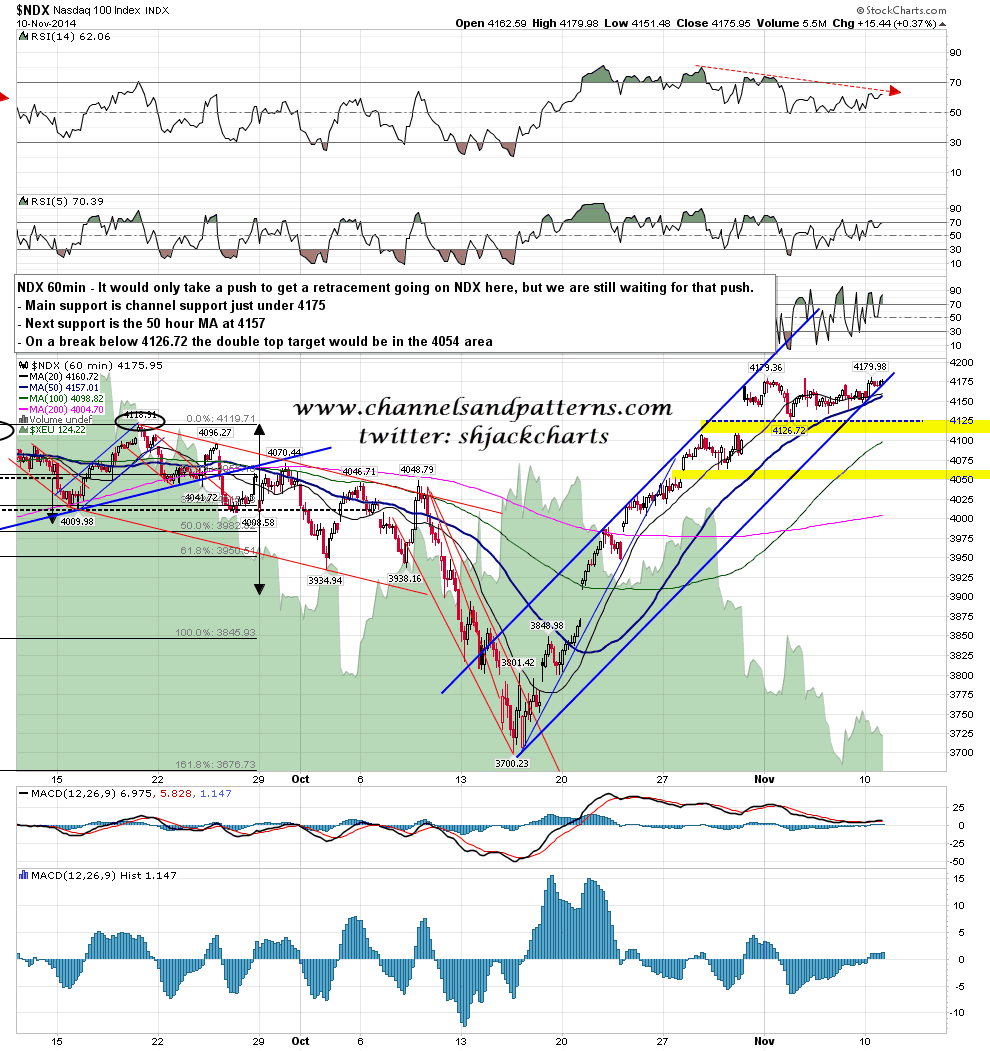
Every so often I see a pattern that only becomes apparent at a late stage, such as this rising channel on NDX that established yesterday. This is a very toppy looking setup on NDX that just needs a push to get a retracement going. I’ll be watching this today for signs of weakness. NDX 60min chart:
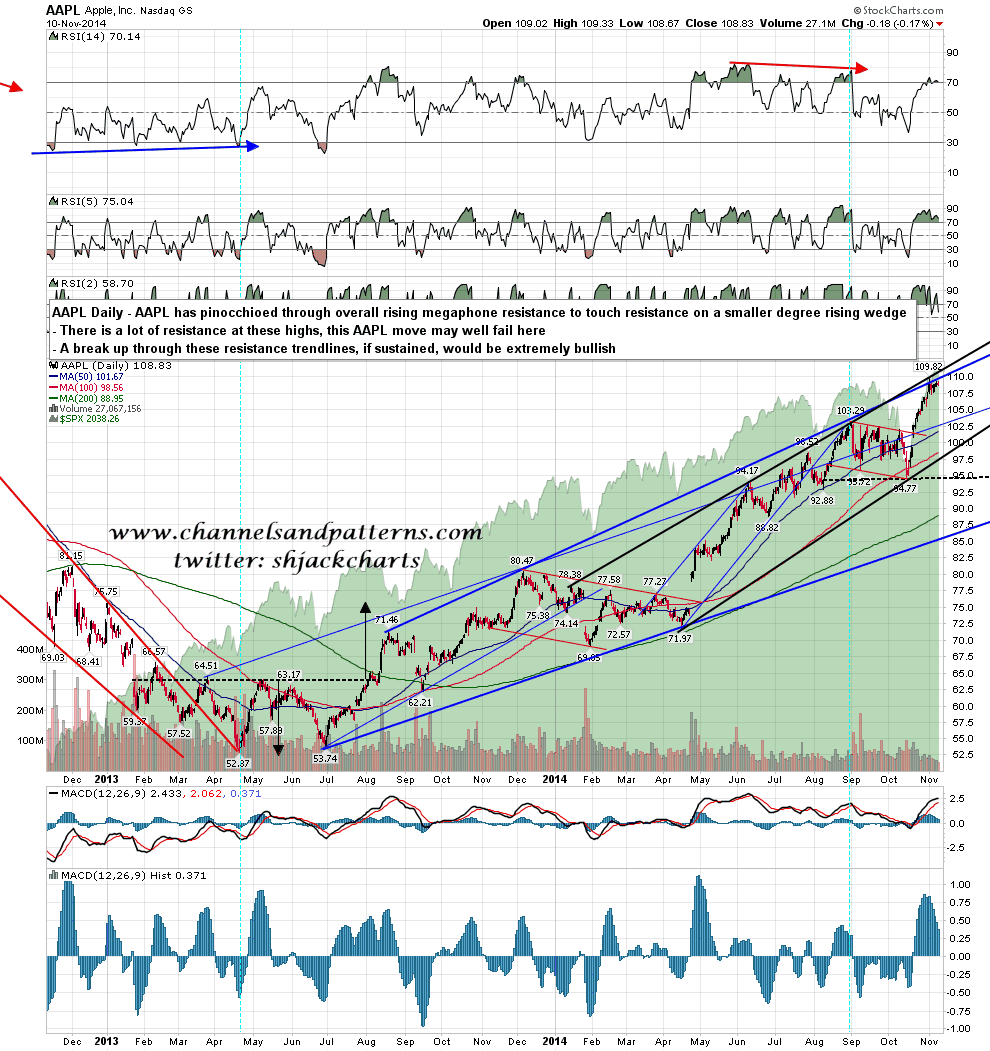
Is there reason for weakness on NDX? Well AAPL stalled at rising megaphone resistance a few days ago and isn’t yet showing any sign of breaking up through it. At the least this is a natural area to see a pullback. AAPL daily chart:
We are likely to see a retrace soon that has a decent chance of retesting the 2000 level. When? When it’s ready. I’m looking for resistance in the 2040-5 area and if SPX finds resistance there we may see that retracement start today. An hourly close below the 20 hour MA, currently at 2031, should be a decent signal that the retracement has started.
