
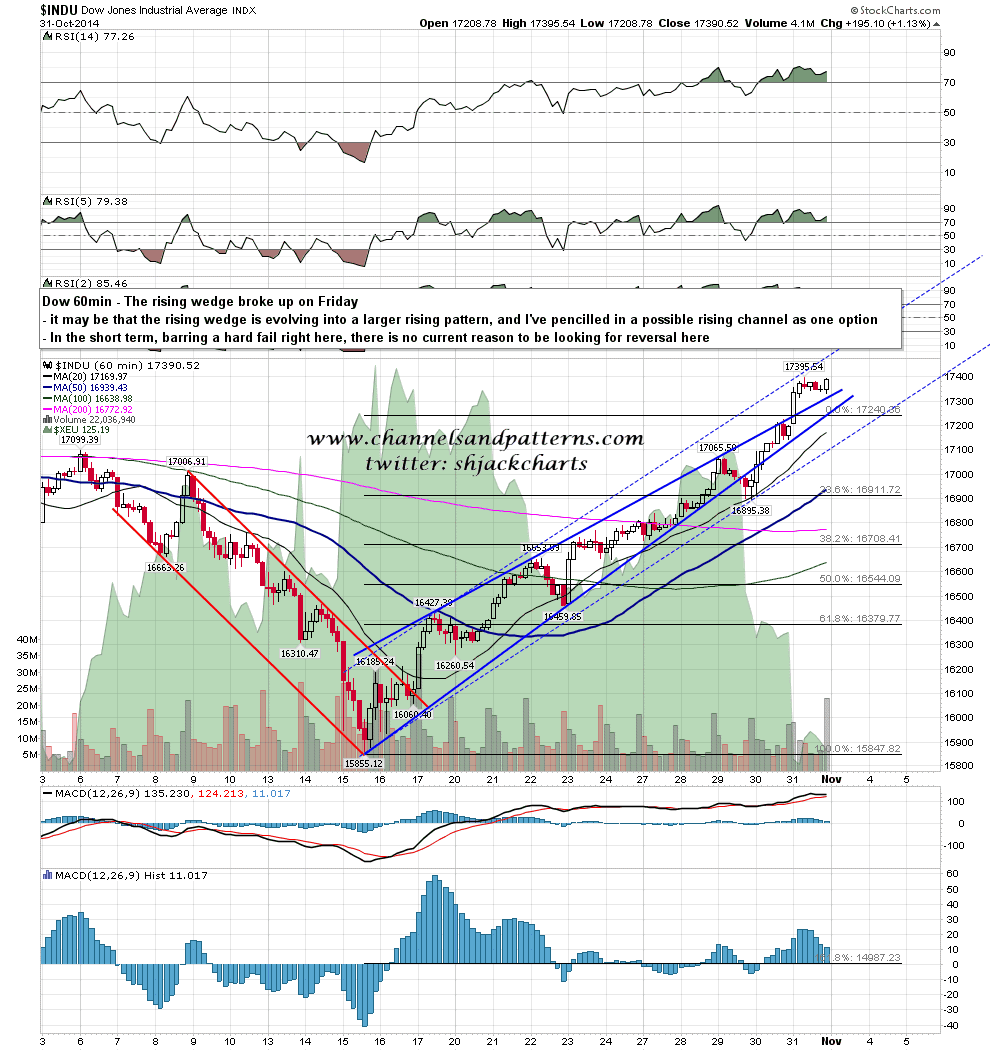
The rising wedges on Dow and SPX broke up on Friday after the BOJ QE expansion and held that break into the close. There is no longer any negative RSI divergence on the 60min chart and there never was on the daily, so at the moment there is no active reversal setup here on Dow or SPX. Dow 60min chart:
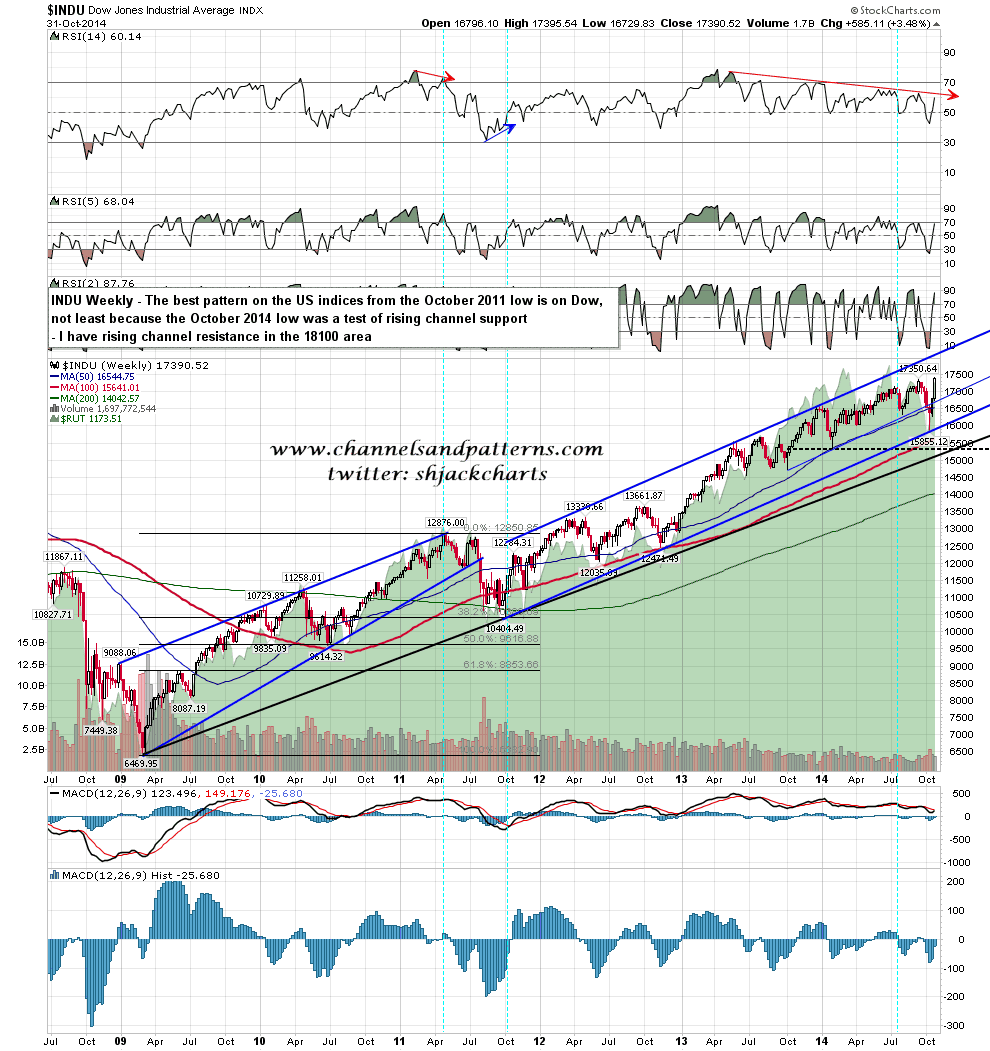
If we see a continuation up then I’ll be watching the main resistance trendlines from the October 2011 low. The best pattern from that low is on Dow, not least because the October low was a test of pattern support, and that is a rising channel with channel resistance in the 18100 area. Dow weekly chart:
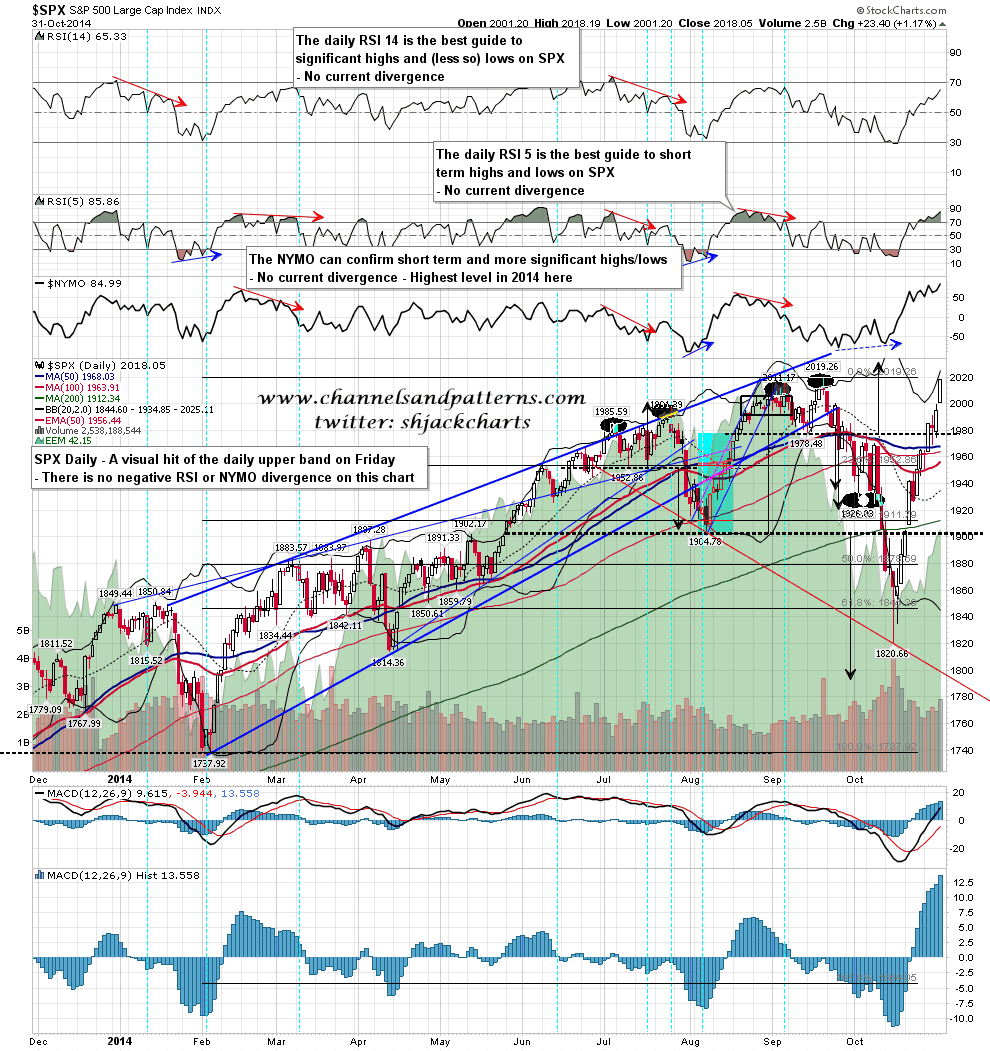
On SPX the daily upper band closed on Friday at 2025. There is what I would call a visual hit of the upper band, but not yet a full hit so that is an open target above. SPX daily chart:
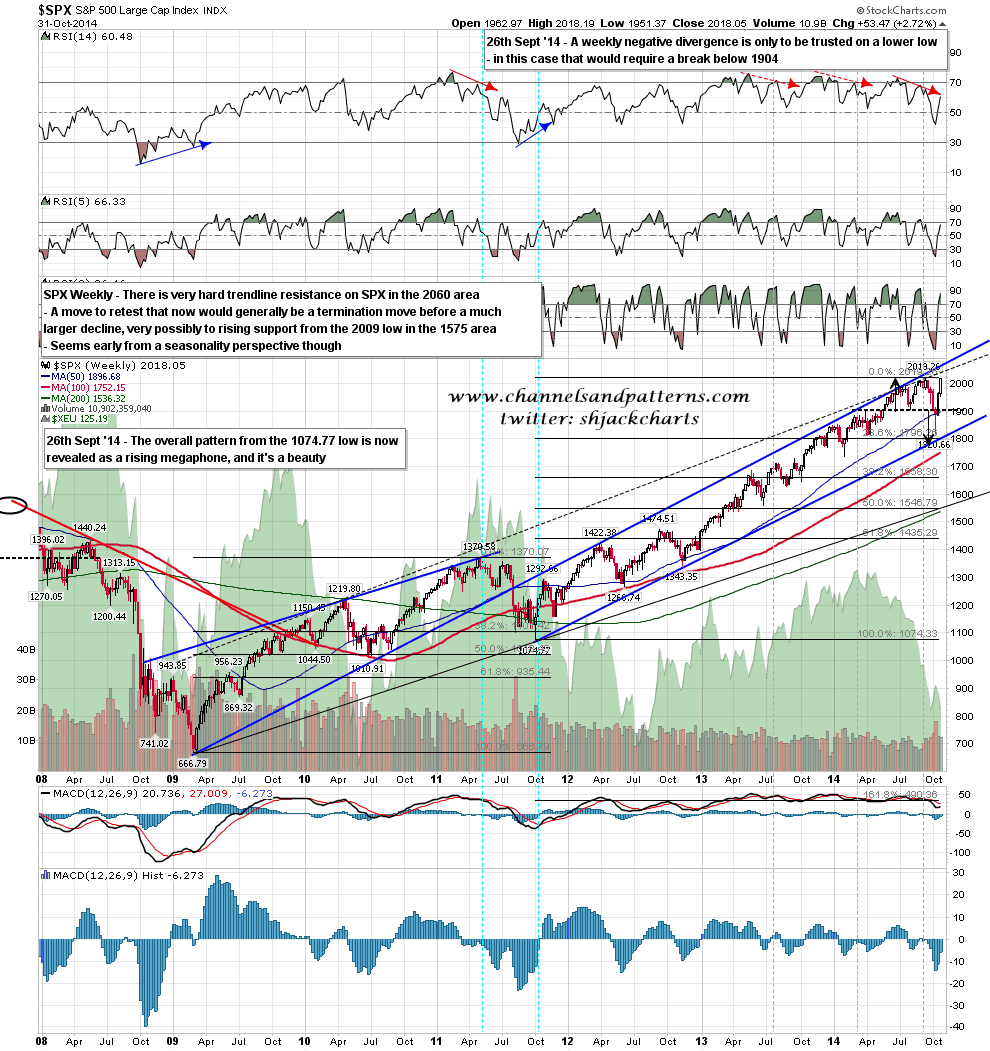
The weekly upper band on SPX is now at 2035, and I have rising megaphone resistance from October 2011 now in the 2060 area. SPX weekly chart:
The monthly candle on SPX was a really very nice hanging man. This is generally regarded as a bearish candlestick, but in truth it just indicates that buyers may be losing control and Bulkowski has these breaking up 59% of the time. The hanging man close at the high generally indicates at least some more upside short term, even if the next monthly candle resolves down.
The stats for the first trading day of November lean bullish and Dow has closed up 4 of the last 5.
