
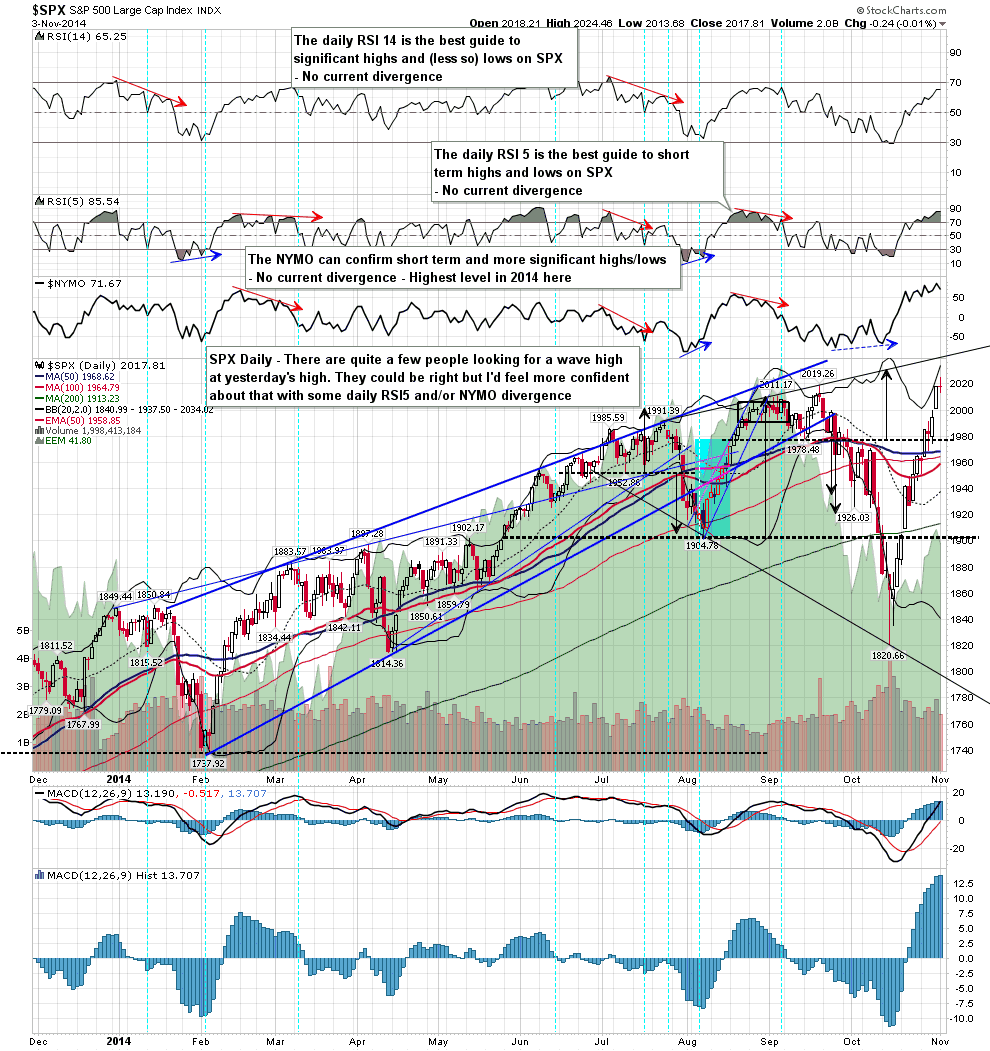
Another new all time high yesterday with an indecisive daily candle. There were quite a few calls for a wave high yesterday at the close yesterday and there is a case for that, but that’s unsupported so far by any negative divergence on the daily RSI 5 or NYMO area, so it’s a definite maybe. If we don’t see a break under the 1985 area, I’m looking for trendline targets in the 2040 or 2060 area to be hit before any big reversal. SPX daily chart:
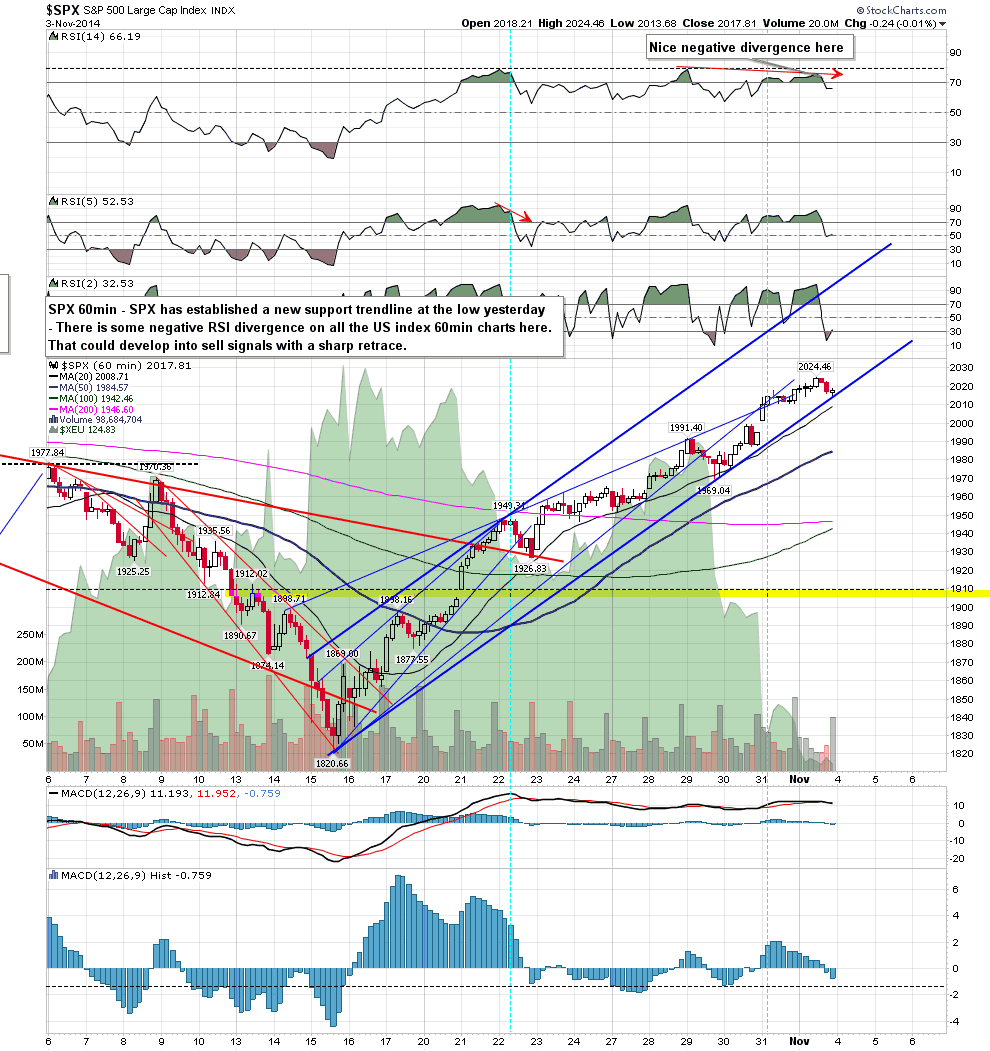
The SPX 60min chart is open to the short side here. The low yesterday established a new support trendline that may break at the open, and there is significant negative divergence on the 60min RSI 14s on most US indices. A strong push down today could trigger sell signals on these. SPX 60min chart:
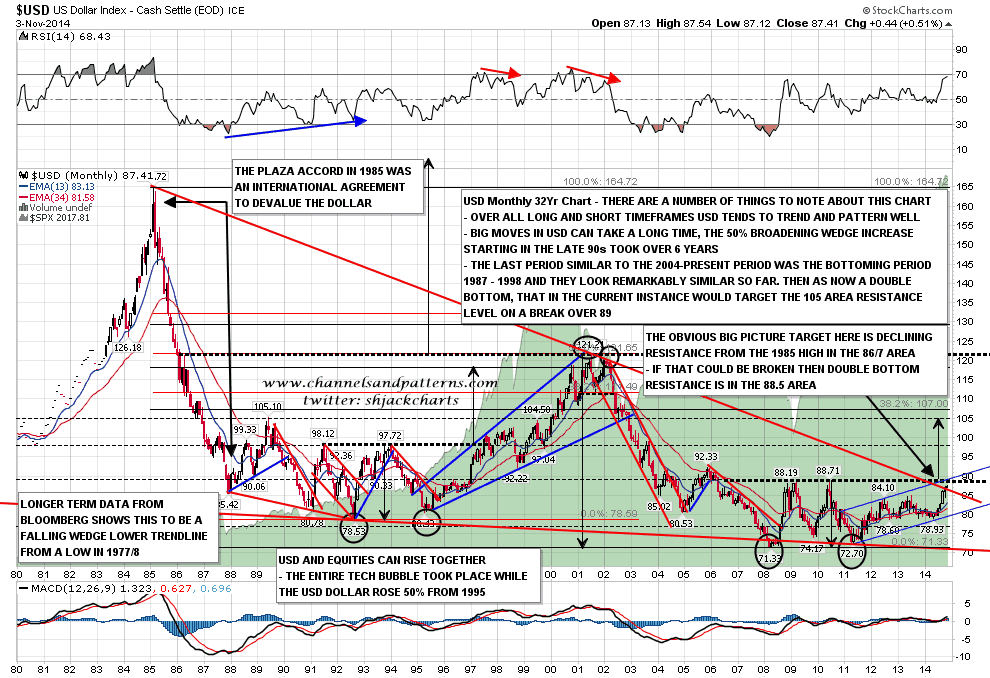
The big news here though is on USD, where the falling wedge resistance trendline from the 1985 high has at last been broken. This opens up the possibility that we will see the move to 105 that I have been posting about for a year or two, though shorter term I’m expecting a high near here and then a big retracement, USD monthly chart:
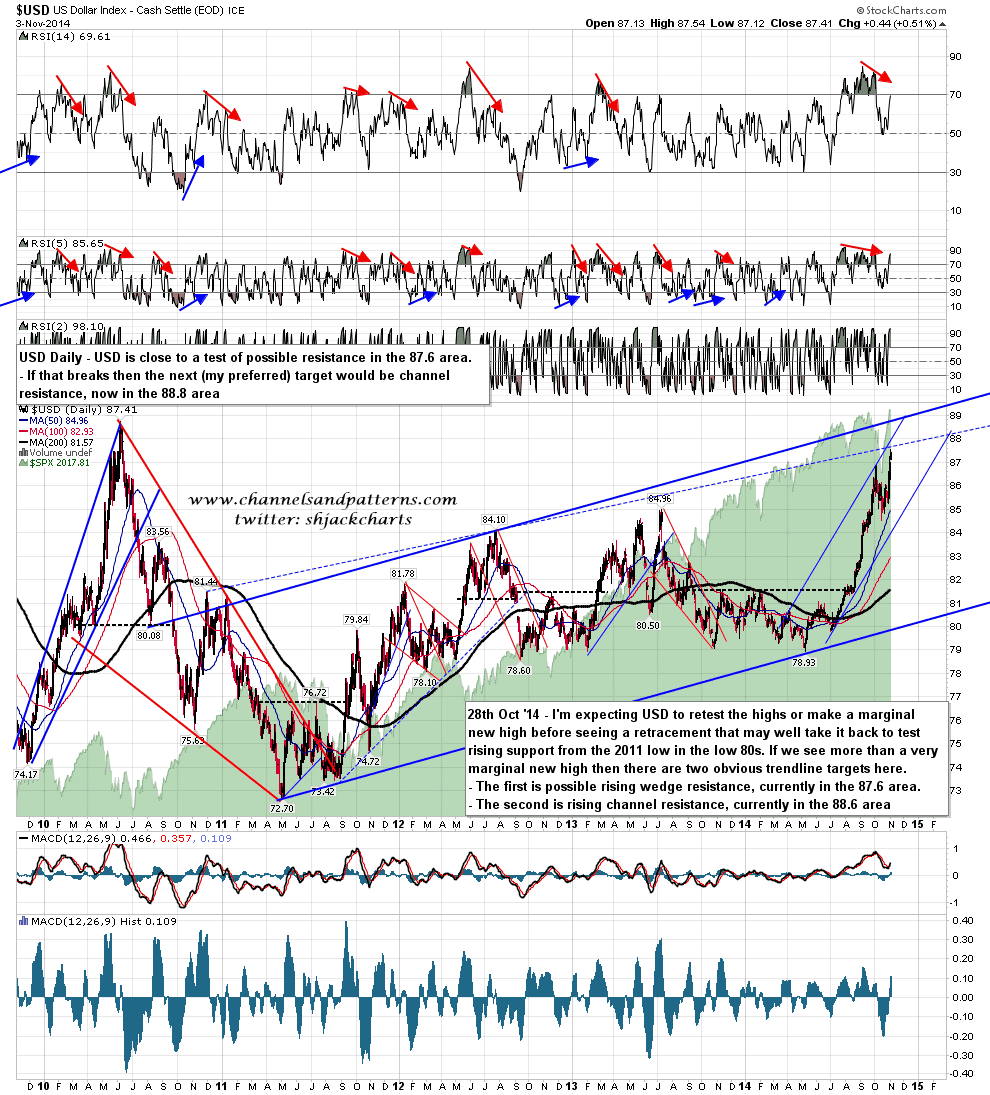
I have two possible trendline targets for USD here. The first would be rising wedge resistance in the 87.60 area, and that was almost reached yesterday. My preferred target though would be rising channel resistance in the 88.80 area, and we could see that tested this week. On that test I’d be looking for a reversal back into channel support, currently in the 80 area. USD daily chart:
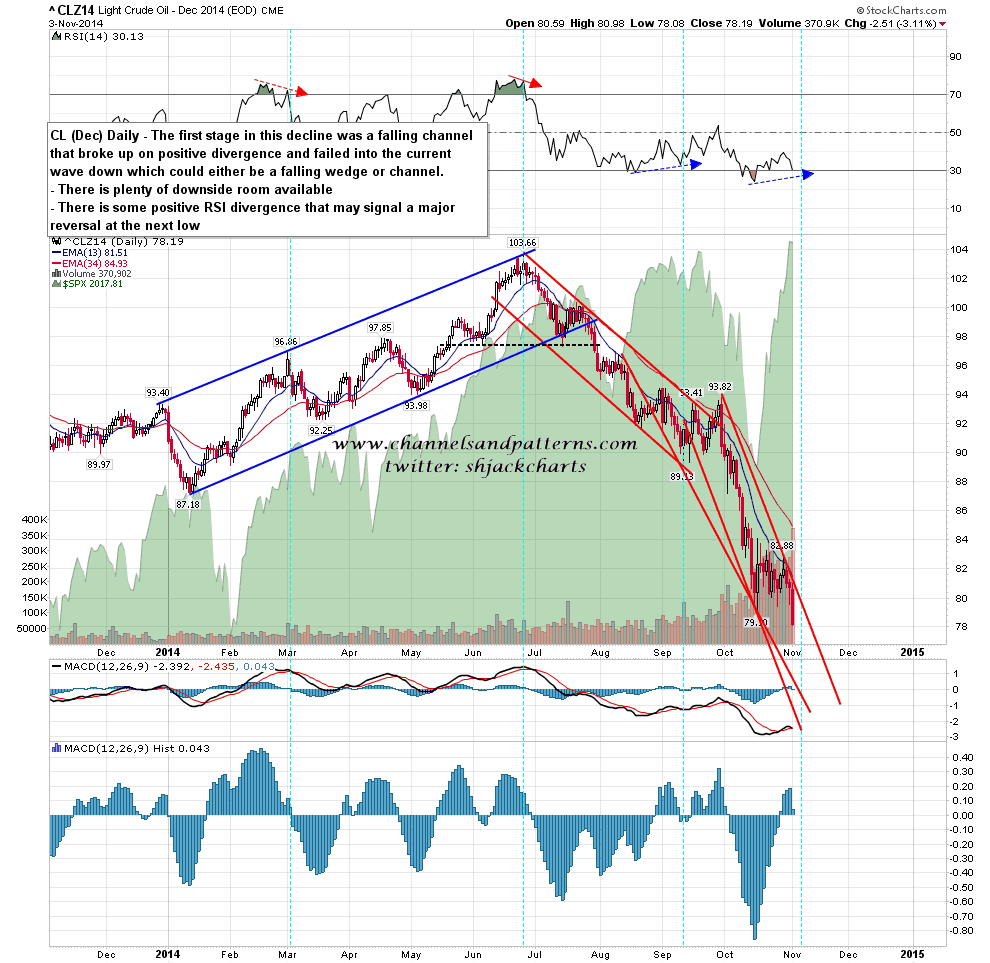
CL has been tough to call in recent months. The decline started in June with a falling channel that broke up and then failed hard into a steeper decline. I am currently looking at alternate falling wedge and channel support trendlines in the 74/5 area, and a break over current declining resistance should be a strong bull signal. CL Dec daily:
I have 15min sell signals on equity indices here and negative divergence on their 60min RSIs. We may see some retracement today and if we see that I’d be looking for strong support in the 1995-2000 area. Unless we see a break under 1985 I’ll be assuming that there will be a higher high coming after that retracement, as I can’t see a strong reason to think otherwise here yet.
