
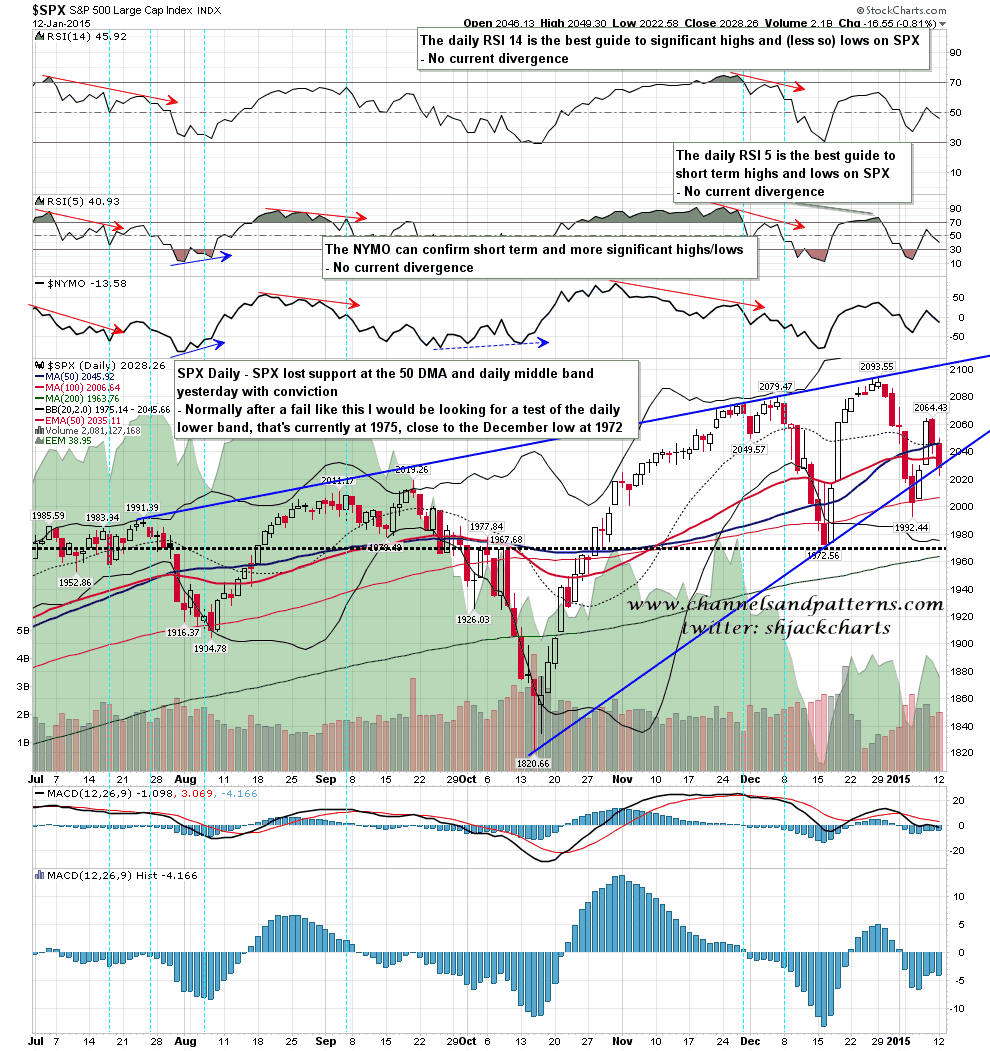
The bulls had a very bad day yesterday, and on the daily chart there was a conviction break below the 50 DMA and the middle band, as well as breaks of lesser support at the 100 DMA and already broken rising wedge support. Generally speaking after a break of this kind I’d be looking for a touch of the daily lower band before another break back over the middle band, and if we are to see that then that is currently at 1975, just above the December low (and double top support) at 1972. SPX daily chart:
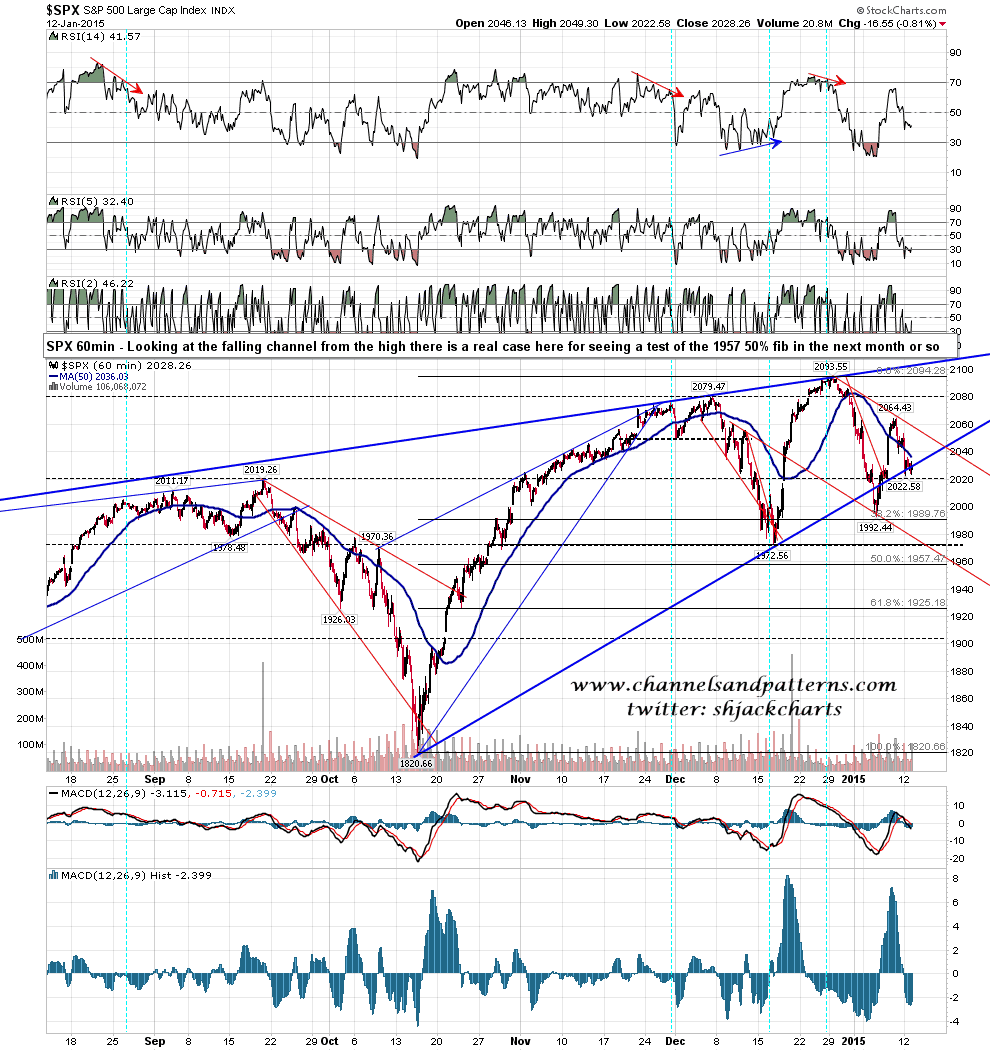
Also lost was support at the 50 hour MA. That’s now at 2036 and I’ll be looking for some resistance there this morning. There may be a falling channel now from the all time high and I’ll be keeping an eye on that. SPX 60min chart:
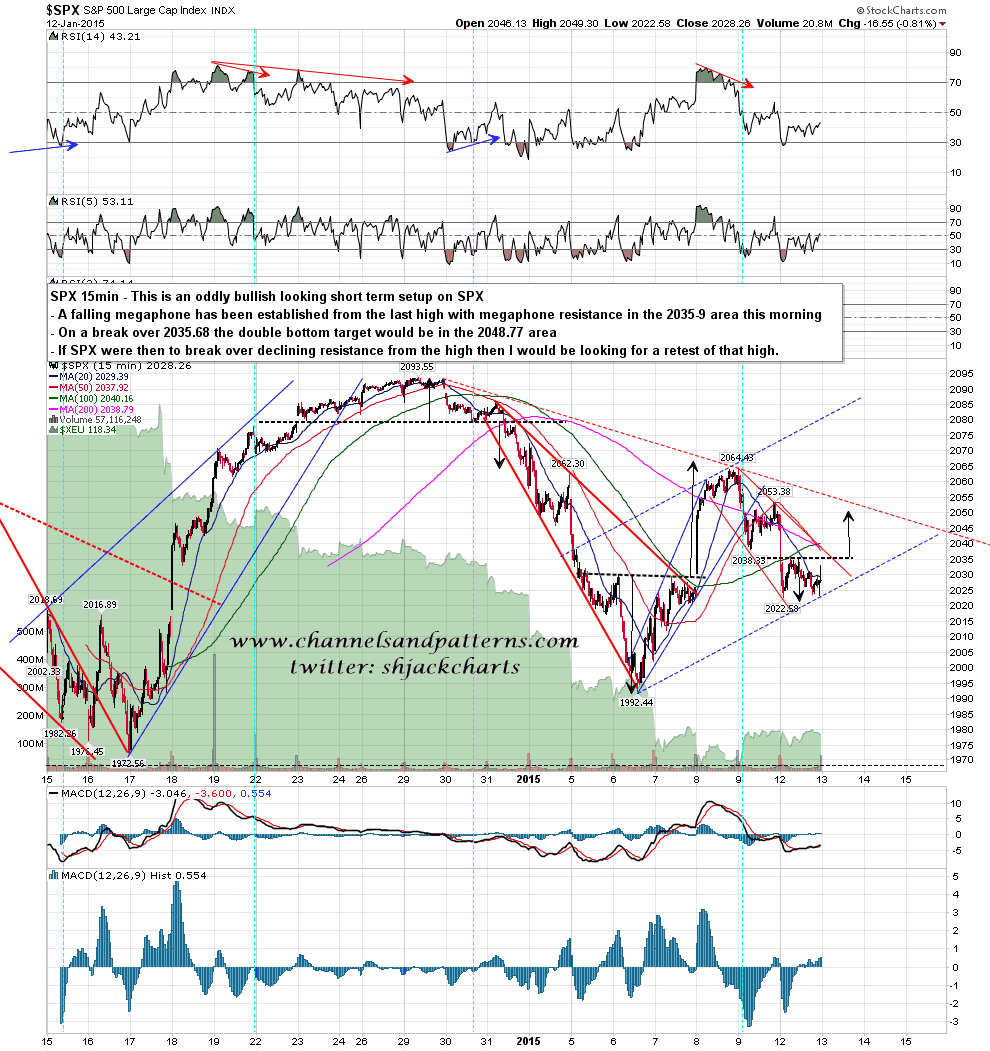
On the 15min chart, by contrast, I’m showing the also not unimpressive short term bull case here. The pattern from the last high is a nice looking falling megaphone, and a short term double bottom has formed that would target the 2049 area on a break over 2036. I have declining resistance from the all time highs now in the 2050-5 area and if that were to break up I’d be looking for a retest of the highs. SPX 15min chart:
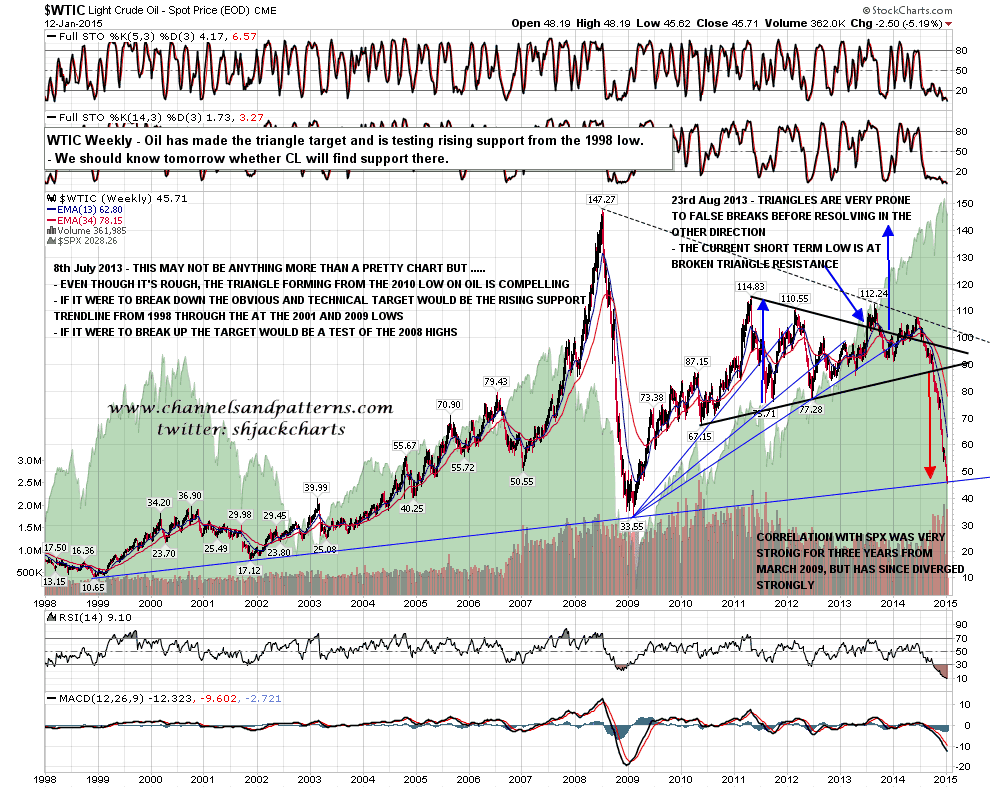
Oil finally hit my main support trendline from the 1998 low yesterday, and broke it with some conviction. We may well see a bounce into the 46s today after yesterdays’s epic 7% decline on CL, but I’d be looking lower after that. WTIC weekly chart:
The signals on SPX here should clarify in the first hour today. If we see SPX break back over 2040 then I’d be looking for 2050 and a possible retest of the highs. A hard fail in the 2035-40 area should deliver a move to 2000 and possibly considerably lower.
