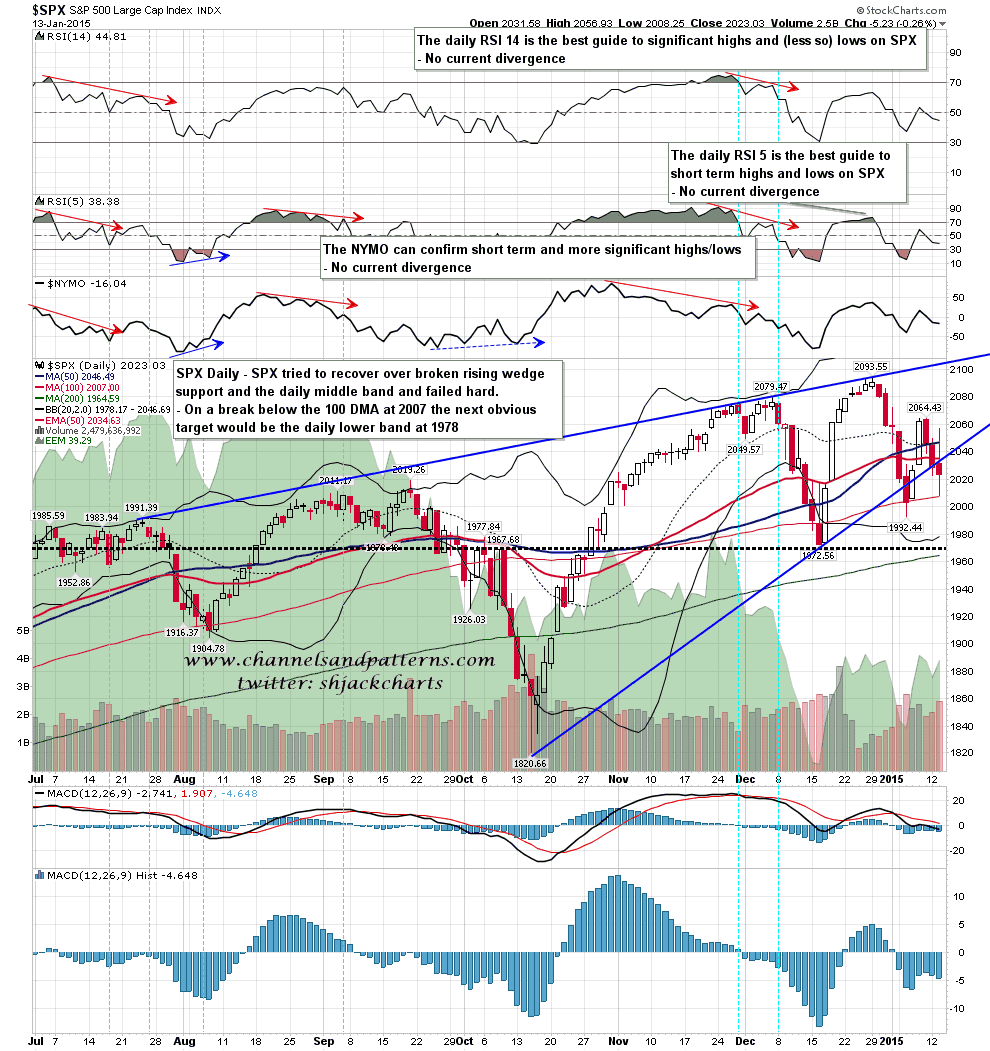
When I was presenting my mixed picture yesterday morning I wasn’t really considering the possibility that both my bull and bear scenarios would then play out in sequence, but that’s what happened with the bull scenario playing out and failing at the declining resistance trendline from the all time high, and then a hard rejection and break below the previous day’s low. This was in effect an attempt to recover over both rising wedge support and the daily middle band and that attempt was crushed, again. SPX daily chart:
Slope of Hope Blog Posts
Slope initially began as a blog, so this is where most of the website’s content resides. Here we have tens of thousands of posts dating back over a decade. These are listed in reverse chronological order. Click on any category icon below to see posts tagged with that particular subject, or click on a word in the category cloud on the right side of the screen for more specific choices.
One That REALLY Got Away
Ugh, this one hurts. I suggested shorting Ocwen Financial as you can see from last June when it was in the mid-30s. It’s a single digit stock now, only seven months later. Hurray for the great recommendation. Boo for not hanging on.
Big Picture Views
With all the hype and noise built in to daily and weekly market management, sometimes it is worthwhile to dial out, calm things down and touch base with markets on the big picture. Here are views on various markets (with limited commentary) by way of some NFTRH monthly charts.
Let’s start with currencies, since they are a reflection upon global policy making, which has been unprecedented in its direct market interference over the last few years.
Nominal Charts – Currency
We noted the hot air patch in the Canada dollar last year. I had thought CDW might stop and find support at 85, which is a measurement from the topping pattern; but so far, no dice.
Compelling Breakout Formations
Here is Today’s Watch List of compelling breakout pattern formations: AXLL, BBY, LRCX, STM, SYRG, TK.


