
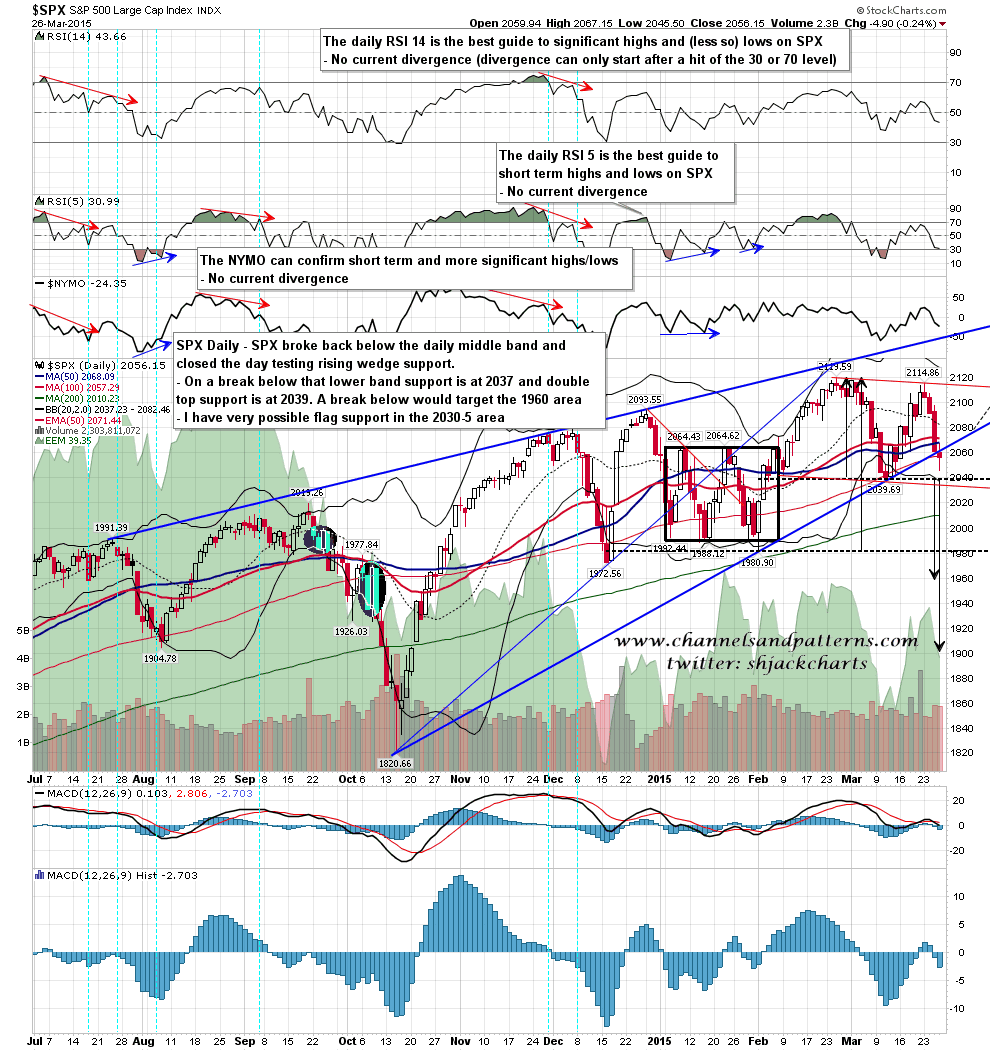
SPX made a low at 2045 yesterday morning and has been chopping around since. There is much talk that the low is in but I doubt it. My 5 DMA stat is expecting a break below the 2039.69 low and we haven’t seen that yet, and I still have possible bull flag support in the 2030-5 area. If that isn’t the reversal area I’d be looking down rather than up for the next targets. SPX daily chart:
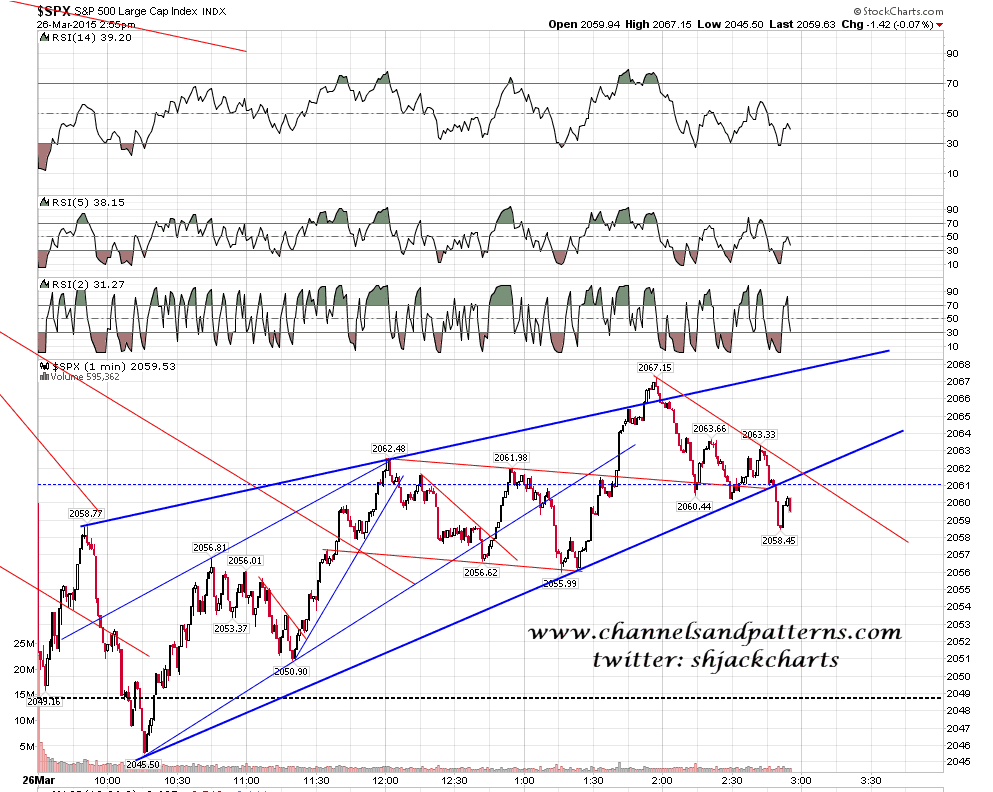
The move up from the low yesterday was a rising wedge which then broke down in the afternoon. I posted the chart below on twitter then with the comment that in this context that rising wedge would generally be a larger degree bear flag, with the target either a retest of the low / marginal new low, or an extension down to the 2000 area if the first target failed to hold. That remains the case. SPX 5min chart:
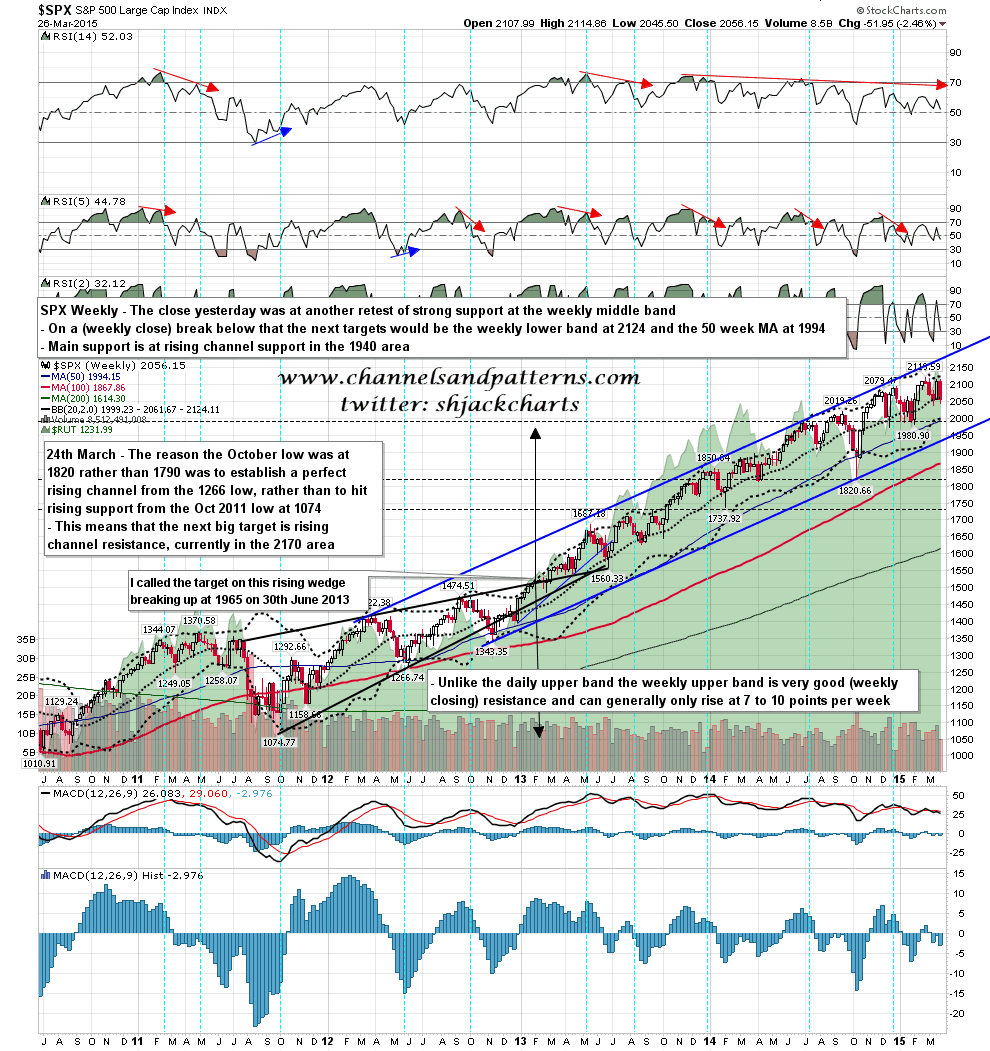
As it is Friday today the close is important on the weekly bollinger bands. The middle band is at 2061 and ideally today I’d like to see a test of the 2030-5 area and then a close back near or over 2061. That could be a tall order of course so we’ll see how that goes. SPX weekly chart:
I’m leaning bearish until the 2039.69 low is broken. After that I’ll be looking for a possible low, ideally in the 2030-5 area. There is a significant chance that SPX would run away to lower targets, though I think that’s still unlikely.
I’ll be doing a weekend post on bonds explaining why I think a very big move down has started that should at least reverse the entire move up since the start of 2014.
