
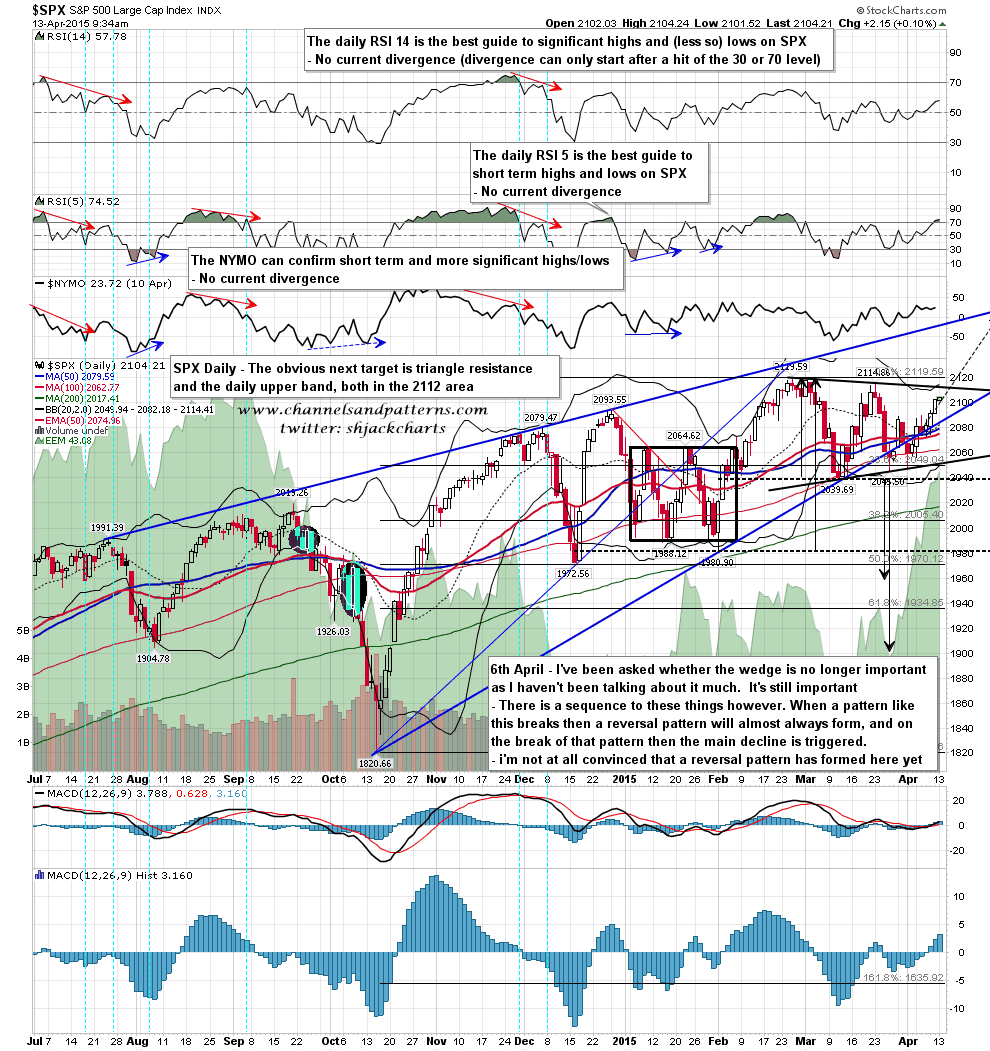
Another strong day on SPX on Friday, and the very obvious target at triangle resistance and the daily upper band in the 2112 area is getting close. SPX daily chart:
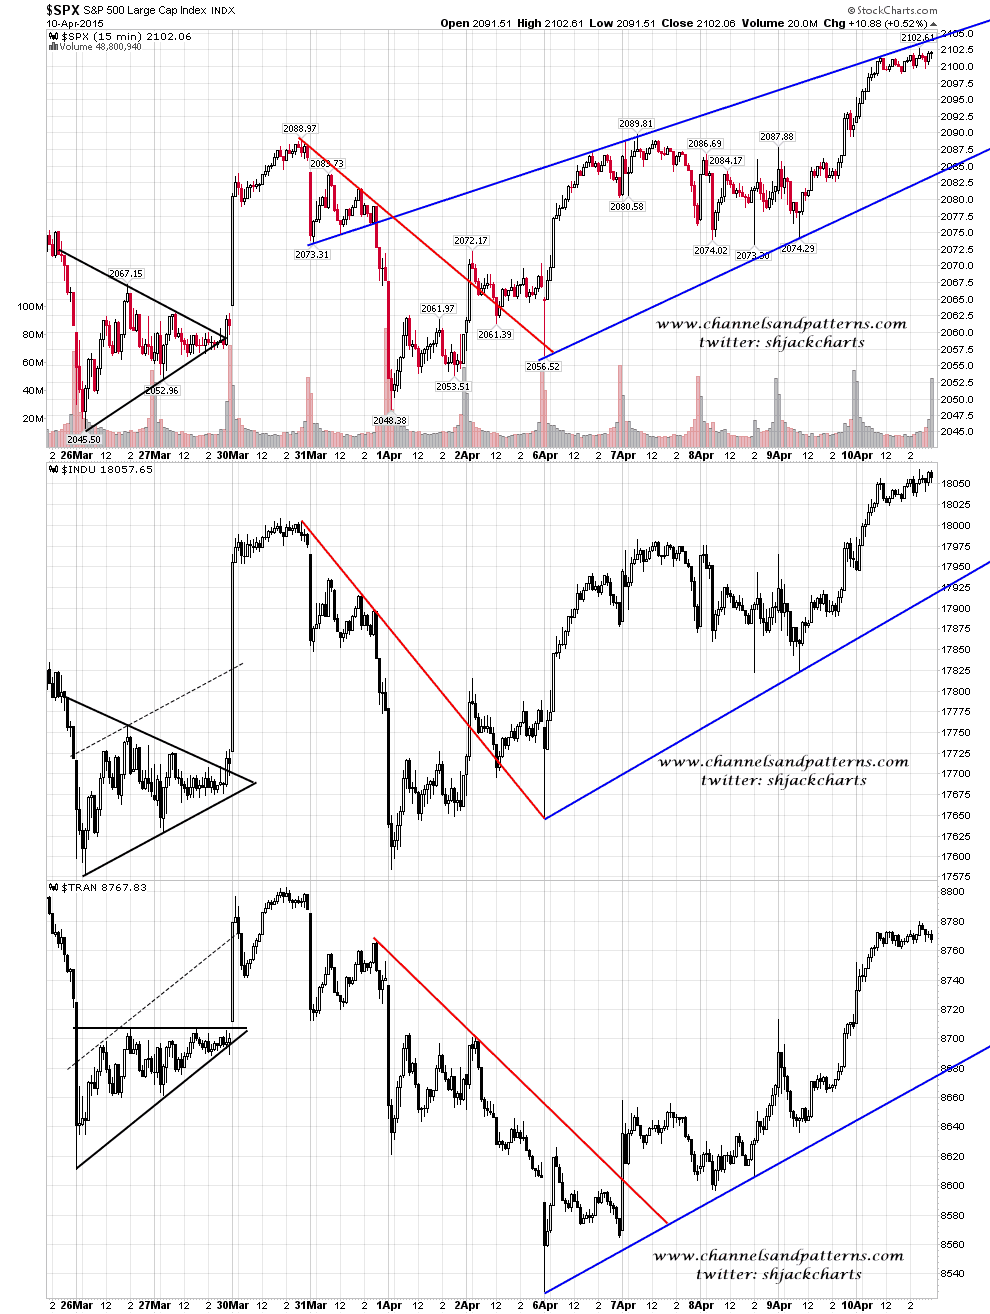
Looking at my multi-index charts there is an argument for seeing a retracement before the 2112 target is hit, but it may be that negative RSI divergence on the 15min chart will just build into the 2112 target. Scan 3x SPX INDU TRAN chart:
When 2112 is hit there are three options. My preferred option is a sharp retrace back into the 2070-85 area, before the triangle breaks up towards new highs. The other two options are either that the triangle breaks up towards new highs immediately or heads back to triangle support in the 2055 area. Key support is at the 50 hour MA at 2080 and it’s important to remember that a small break above triangle resistance is not strong evidence that a triangle is breaking up, as false breaks are normal on triangles.
