
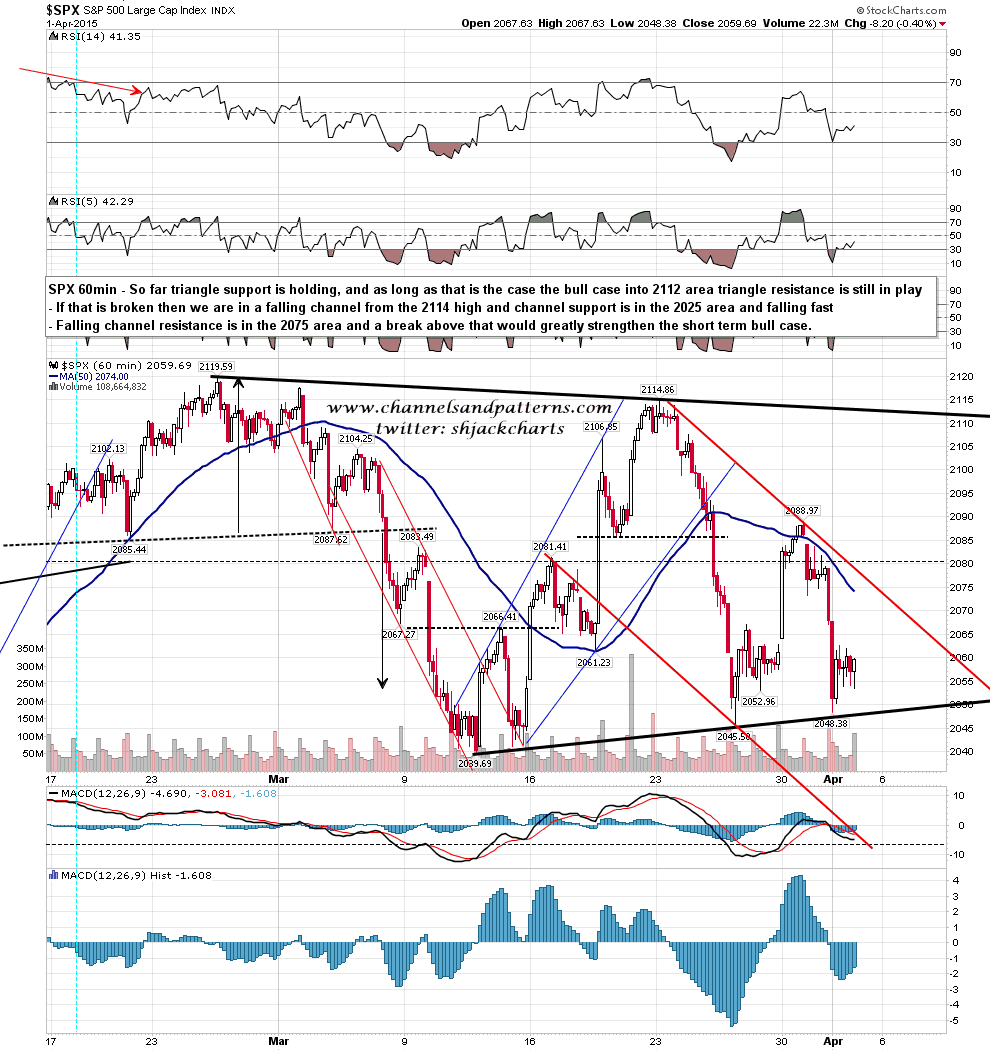
SPX broke back below the 5 DMA yesterday and that break triggers the second setup in the last two weeks that requires a lower low before a higher high. I’ve looked back as far as 2007 without finding an exception to this rule. If SPX is in a triangle here, and the possible triangle is still holding, then that may deliver an exception to this rule. SPX daily 5 DMA:

In terms of the pattern setup the triangle is still intact and SPX is also in a falling channel from the 2114 high. If bears can break triangle support at 2048/9 then falling channel support is currently in the 2025 area. If bulls can break channel resistance, currently in the 2075 area, then triangle resistance is in the 2112 area. SPX 60min chart:
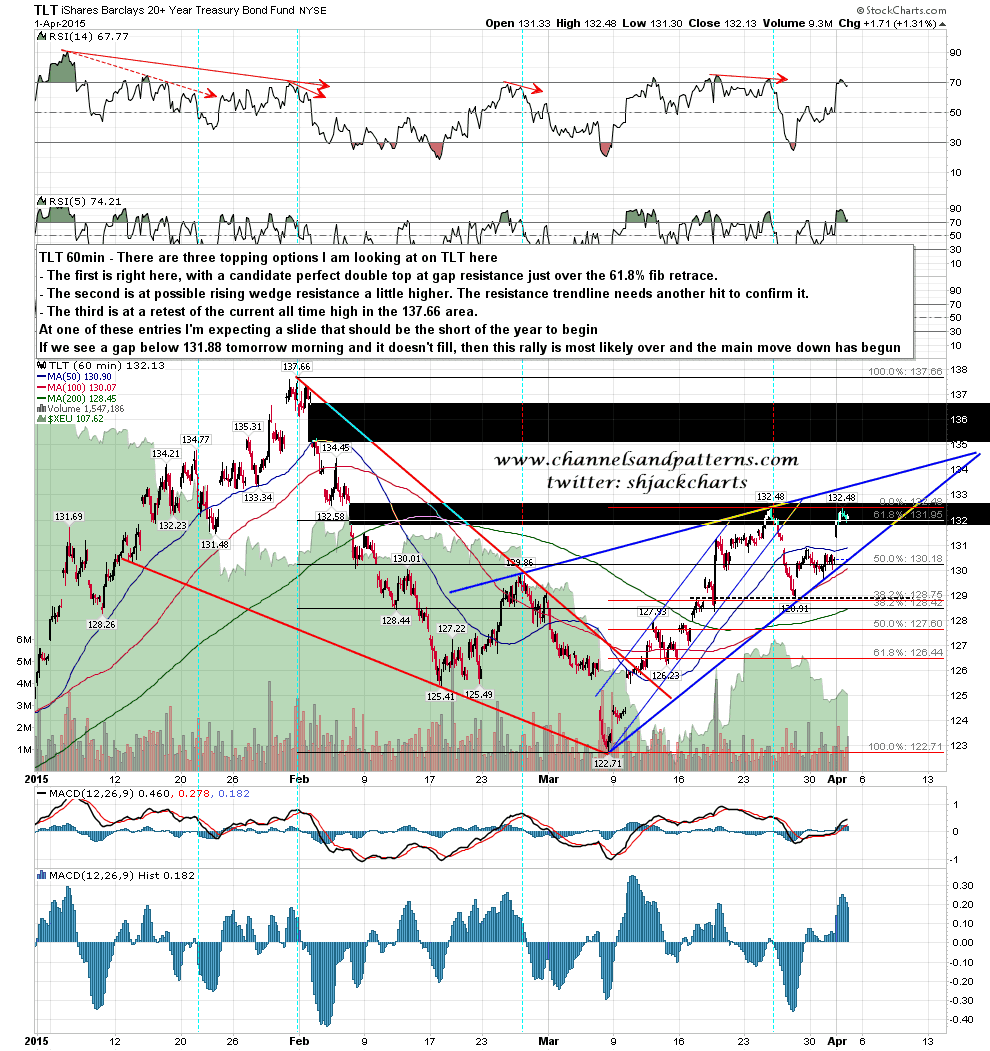
There is a very nice looking reversal setup on TLT here for a reversal back down into what might well be a huge move down. I’m watching for a gap under 131.88 this morning to set the ball rolling. If not then I have two other inflection areas shown on the chart below. TLT is very likely to fail hard at one of these three. TLT 60min chart:
The historical stats for today are strongly bullish, as they were yesterday and as they will also be on Tuesday. I’m reading a lot that the selling season has started at the start of April but that really doesn’t get going traditionally until the start of May, and I’d note that since 1950 April has been the strongest month of the year on the Dow.
Everyone have a great Easter Holiday! 🙂
