
Very late post today as I was out much of the morning and I’ve had a busy open.
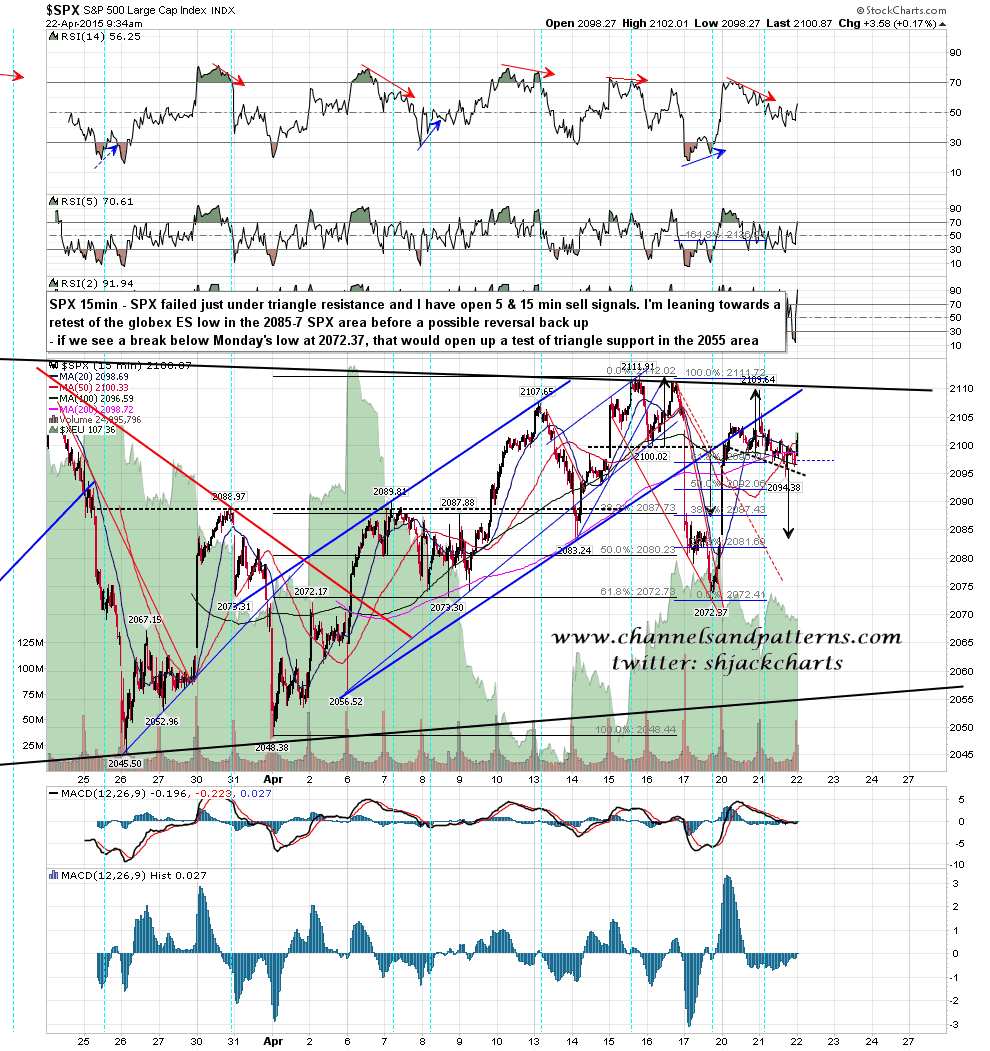
SPX failed just under triangle resistance yesterday and I have open 5min & 15min sell signals here. I’m looking for SPX to most likely test the globex low in the 2083-7 area before another test of triangle resistance. If Monday’s low at 2072.37 is broken, that would open up a test of triangle support in the 2055 area. SPX 15min chart:
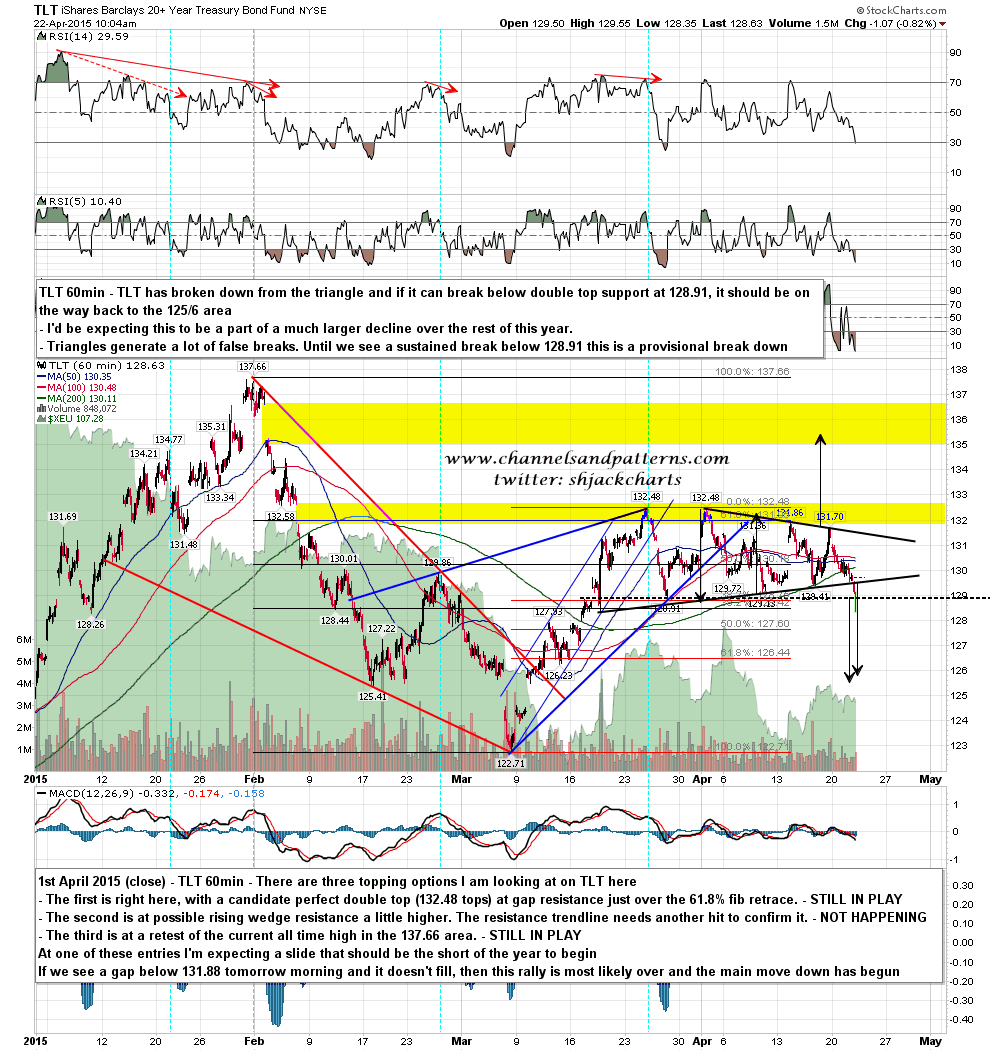
After yet another time-consuming triangle TLT has finally broken down this morning. If that break holds then the target back in the 125/6 area should just be the start of a big move down that I’m expecting to reverse the whole of the move up on bonds since the end of 2013. TLT 60min chart:
ES has traded as low as 2091.05 and as high as 2103.82 since the open. My open sell signals are suggesting strongly that there is still more downside to come so I’m working on the assumption that we will see a lower low under 2091 before the next test of triangle resistance.
