
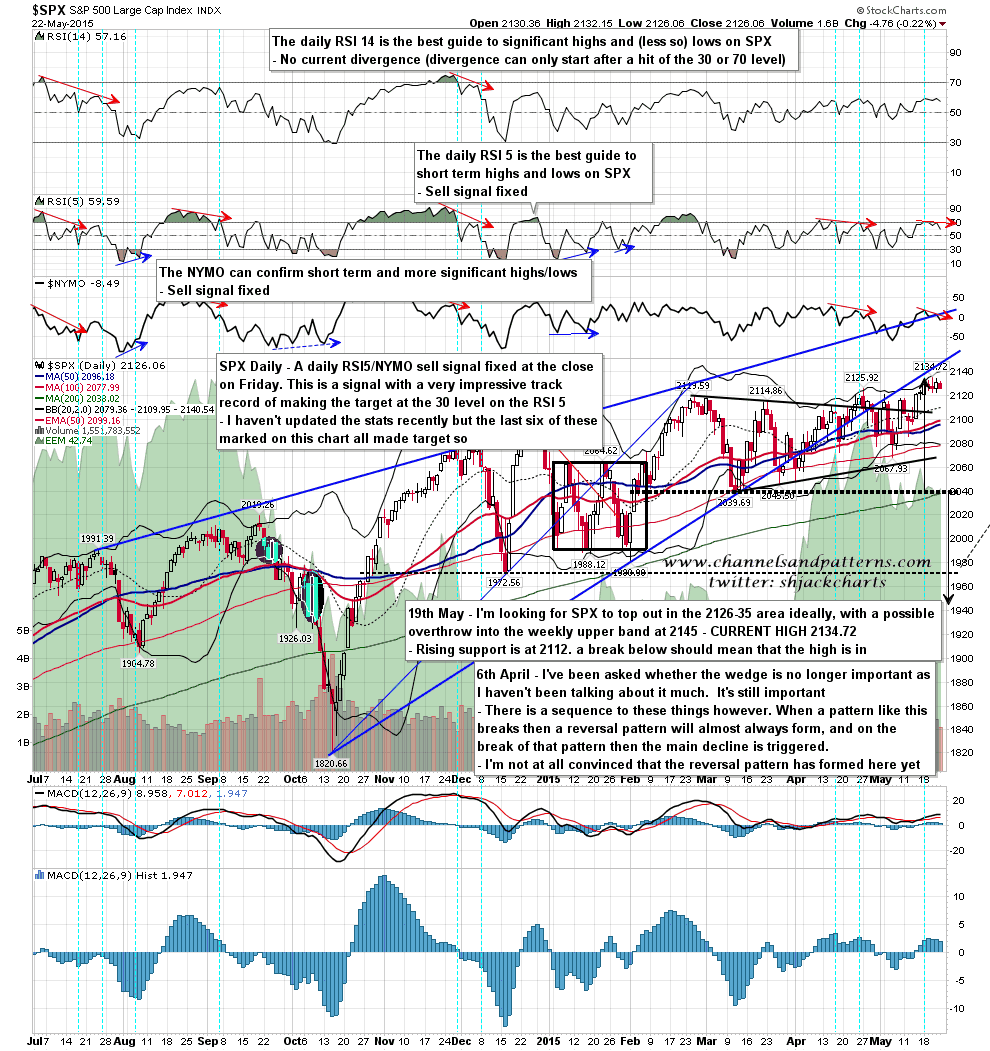
A daily RSI5 / NYMO sell signal fixed at the close on Friday, and this is a very high performance sell signal. I think the hit rate for this signal is 75%+ and I haven’t updated the statistics today as the last six RSI5/NYMO buy or sell signals on the chart below all made target (the 30 level on the daily RSI 5), so the stats certainly aren’t getting worse. This daily sell signal joins the 60min and 15min sell signals still open from last week. SPX daily chart:
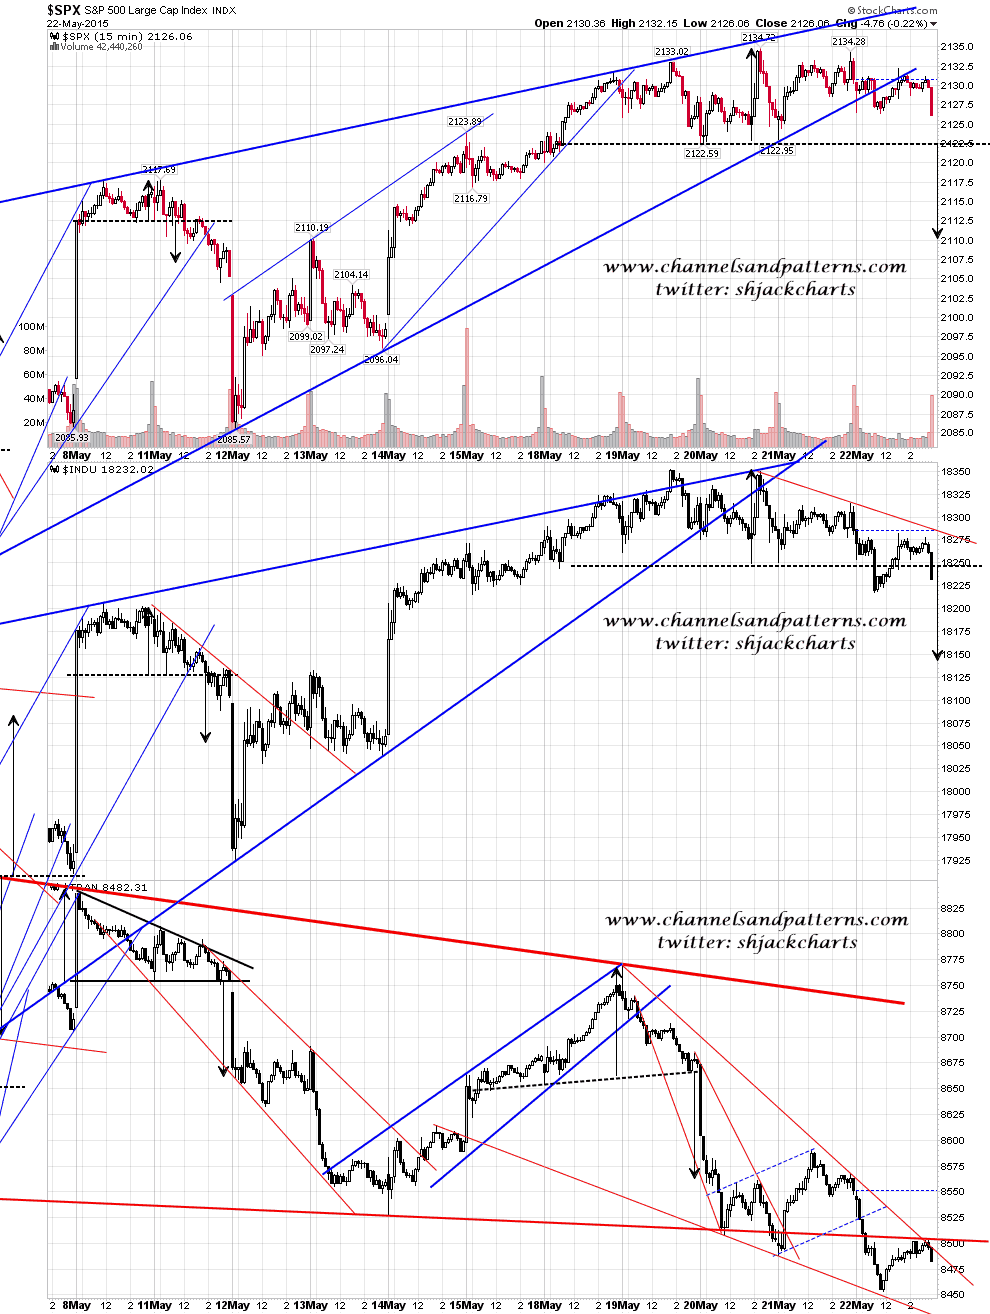
As for the short term pattern setups here they are look as though they are topping or have already topped. That’s with the exception of TRAN which was making new 2015 lows last week. Scan 3x 15min SPX INDU TRAN:
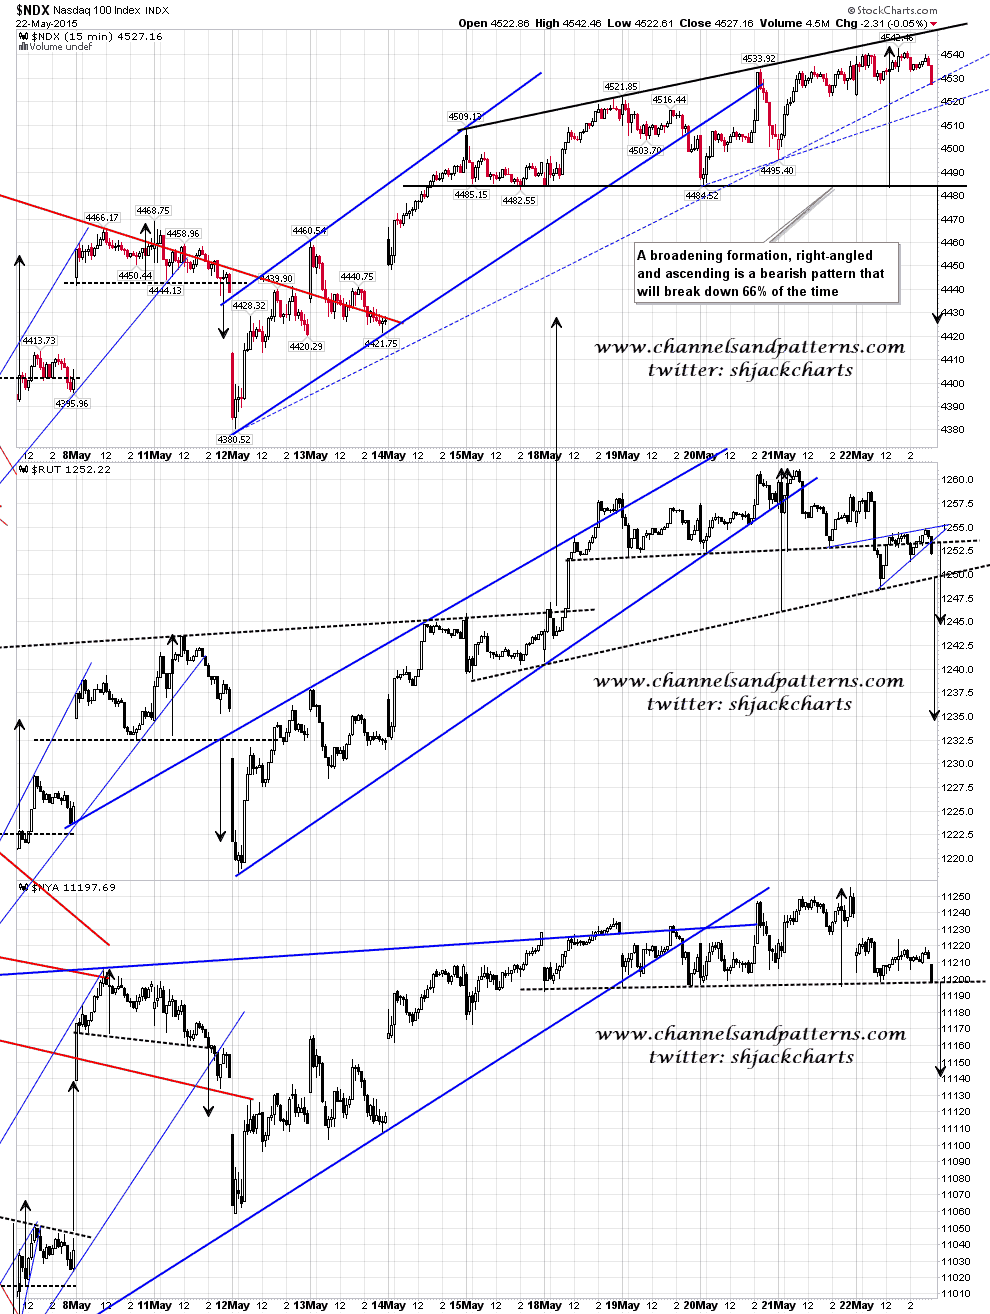
Scan 3x 15min NDX RUT NYA charts:
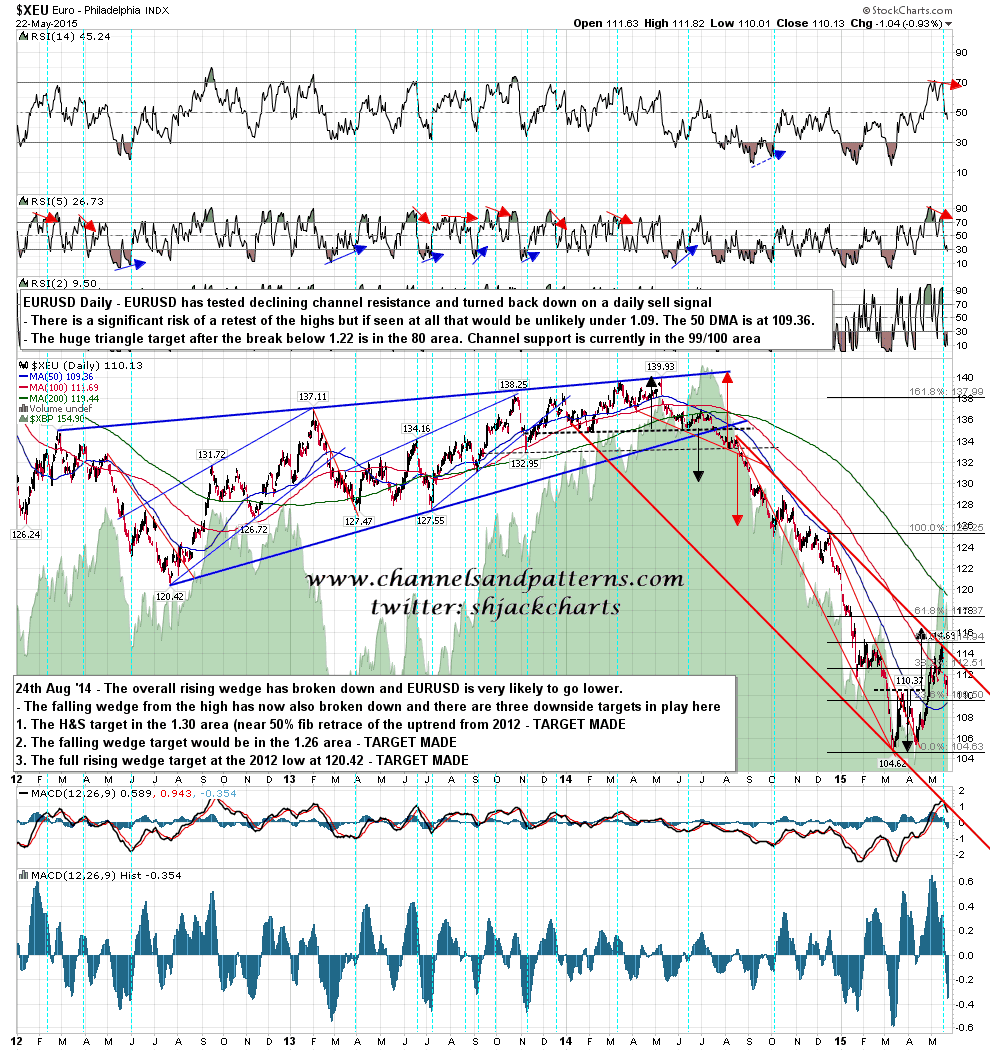
Just a note on EURUSD which has rallied to falling channel resistance and failed there so far. I’m expecting this to continue down though there is a very significant risk of a rally soon as there is no clear topping pattern. EURUSD daily chart:
The indices are breaking down at the open today and I’m expecting this to follow through to the downside . Unless the current all time high is retested and exceeded by a few handles, then I’m thinking that the SPX high for 2015 was most likely made on Wednesday last week at 2134.72, just within the 2126-2135 range I gave as my ideal topping area the previous day. Partly through luck I managed to put a short on at 2132 ES, the exact high once the bid/offer spread is taken into account, and I’m planning to keep that position on for at least 300 handles down, as the obvious main target for this move is a retest of the October low at 1820 SPX. I’ll be trading in and out in the meantime as well of course.
