Slope of Hope Blog Posts

Slope initially began as a blog, so this is where most of the website’s content resides. Here we have tens of thousands of posts dating back over a decade. These are listed in reverse chronological order. Click on any category icon below to see posts tagged with that particular subject, or click on a word in the category cloud on the right side of the screen for more specific choices.

Stiff Trendlines, Slippery Oil

By -

Even though I’ve been charting for decades, I am still in awe of how some of the simplest methods can be helpful.

Trendlines, which are by definition the simplest drawn object even possible, are a favorite example. Check out crude oil’s front month, shown below. This is an important chart to me, because I have so many energy-related shorts. Oil was surging last night, but look at where it peaked: at precisely (virtually to the penny) the descending trendline, which represents resistance.

0616-cl


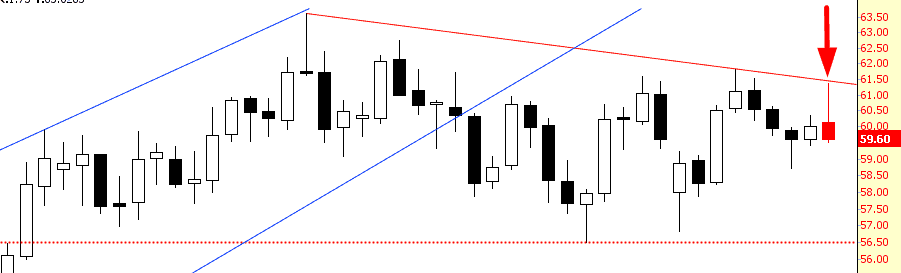
Of course, the real “break” I want is a failure of the 56.51 horizontal line. A failure of that support means it’s party time, at long last.

The Bottom Line

By -

SPX has held the 2072.14 low and has returned to retest the resistance levels broken late last week and then surrendered on Monday. SPX closed back over the 50 hour MA at 2092.7 yesterday, and just under the 5 DMA at 2098. Above there resistance is at the 50 day EMA at 2100, the 50 day MA at 2104 and the daily middle band at 2107. A close back over the daily middle band opens the door to retest the all time high at 2134. SPX daily chart:

150617 SPX Daily Patterns BBs MAs

(more…)