Slope of Hope Blog Posts

Slope initially began as a blog, so this is where most of the website’s content resides. Here we have tens of thousands of posts dating back over a decade. These are listed in reverse chronological order. Click on any category icon below to see posts tagged with that particular subject, or click on a word in the category cloud on the right side of the screen for more specific choices.

Short a Has-Been

By -

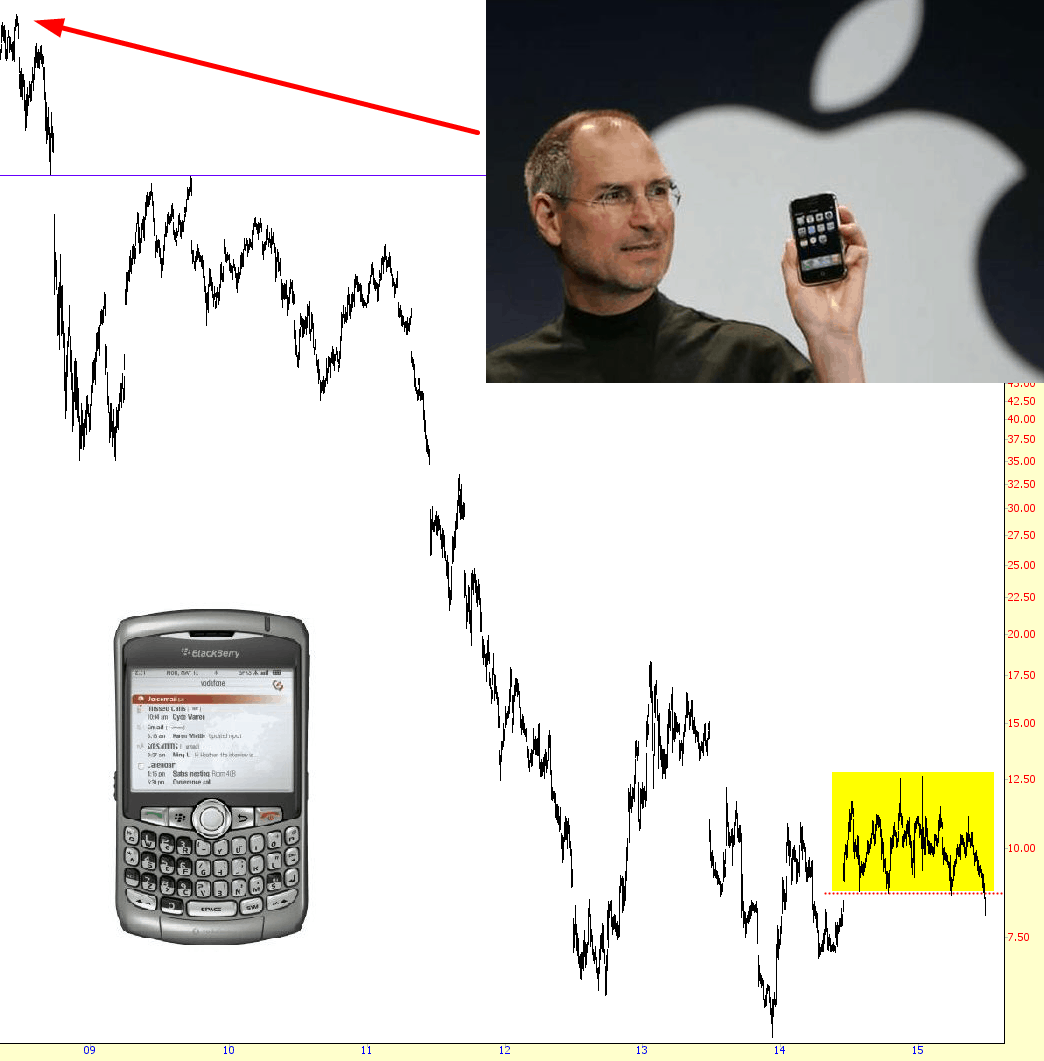
A few days ago, I added Blackberry to my very, very long list of short positions. I don’t know if I’ve ever traded this once-famous stock in my entire life, but the pattern was compelling.

0630-bbry

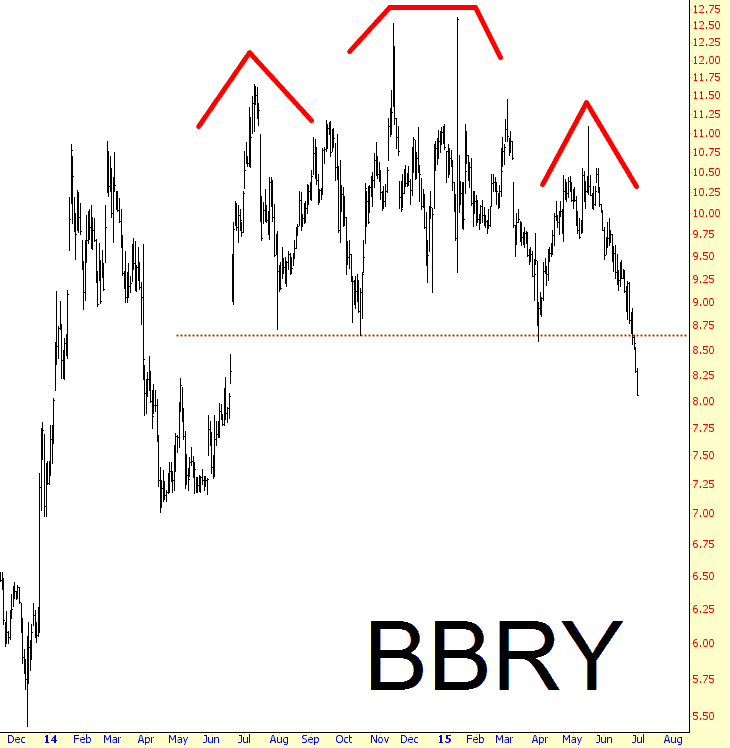
What’s different about this trade is that I typically prefer to short stocks which are insanely high. Those that have already been beaten to smithereens have a lot less potential to be, ummm, beaten to smithereens. All the same, in spite of Blackberry’s humiliating fall from grace, this seems like a company whose stock price is fairly valued at a whole integer that rhymes with “hero”, so I’m going to give this a shot. So far, so good…….

0630-bbrybig

Rubber Bands

By -

Well that was an impressive trend down day yesterday and a lot of technical damage down. I am now officially impressed, and while I had been thinking we might put in the retest high just before the holiday weekend, Greece has pulled that forward a few days and in all likelihood both the 2015 high and the retest are now in the review mirror. This would be a good time to pull together a few reference posts to show where I think we are here.

The first post is from Monday 2nd February where I confirmed that the January close on SPX met the criteria for some very bearish long term stats suggesting very strongly that the best case for SPX in 2015 would be a flat close, and the worst case a large decline. You can see that post here.

(more…)

Bull/Bear Struggle for Control of EUR/USD

By -

The following Monthly chart of EUR/USD Forex pair shows that price has been bouncing (generally) between 1.15 (dotted yellow horizontal line) and 1.08 (solid yellow horizontal line) since February of this year.

At the moment, 1.15 is defined by a confluence of a Fibonacci fanline and a falling trendline…1.08 sits around the lower one-third level of the large price range between the 2000 lows and the 2008 highs.

(more…)