
Well that was an impressive trend down day yesterday and a lot of technical damage down. I am now officially impressed, and while I had been thinking we might put in the retest high just before the holiday weekend, Greece has pulled that forward a few days and in all likelihood both the 2015 high and the retest are now in the review mirror. This would be a good time to pull together a few reference posts to show where I think we are here.
The first post is from Monday 2nd February where I confirmed that the January close on SPX met the criteria for some very bearish long term stats suggesting very strongly that the best case for SPX in 2015 would be a flat close, and the worst case a large decline. You can see that post here.
The second post is from Tuesday 26th May when I called a likely 2015 high the previous day at 2134.72 SPX, added that I had been fortunate enough to short the high tick on ES at that high, and that I would be holding that short into at least the 1820 area at a retest of the October low. You can see that here.
The third post is from my master swing trader friend Alphahorn, who did a public post showing where the SPX, Dow, NDX and RUT are in terms of their Elliot Wave counts, shows the likely target areas and puts us here at the start of Primary Wave 4 from the 2009 low. Stan and I also think that’s the most likely count here so this is a useful reference to bookmark. You can see that post here. Most of Alphahorn’s posts are behind a subscription paywall so I appreciate him making this post available to all.
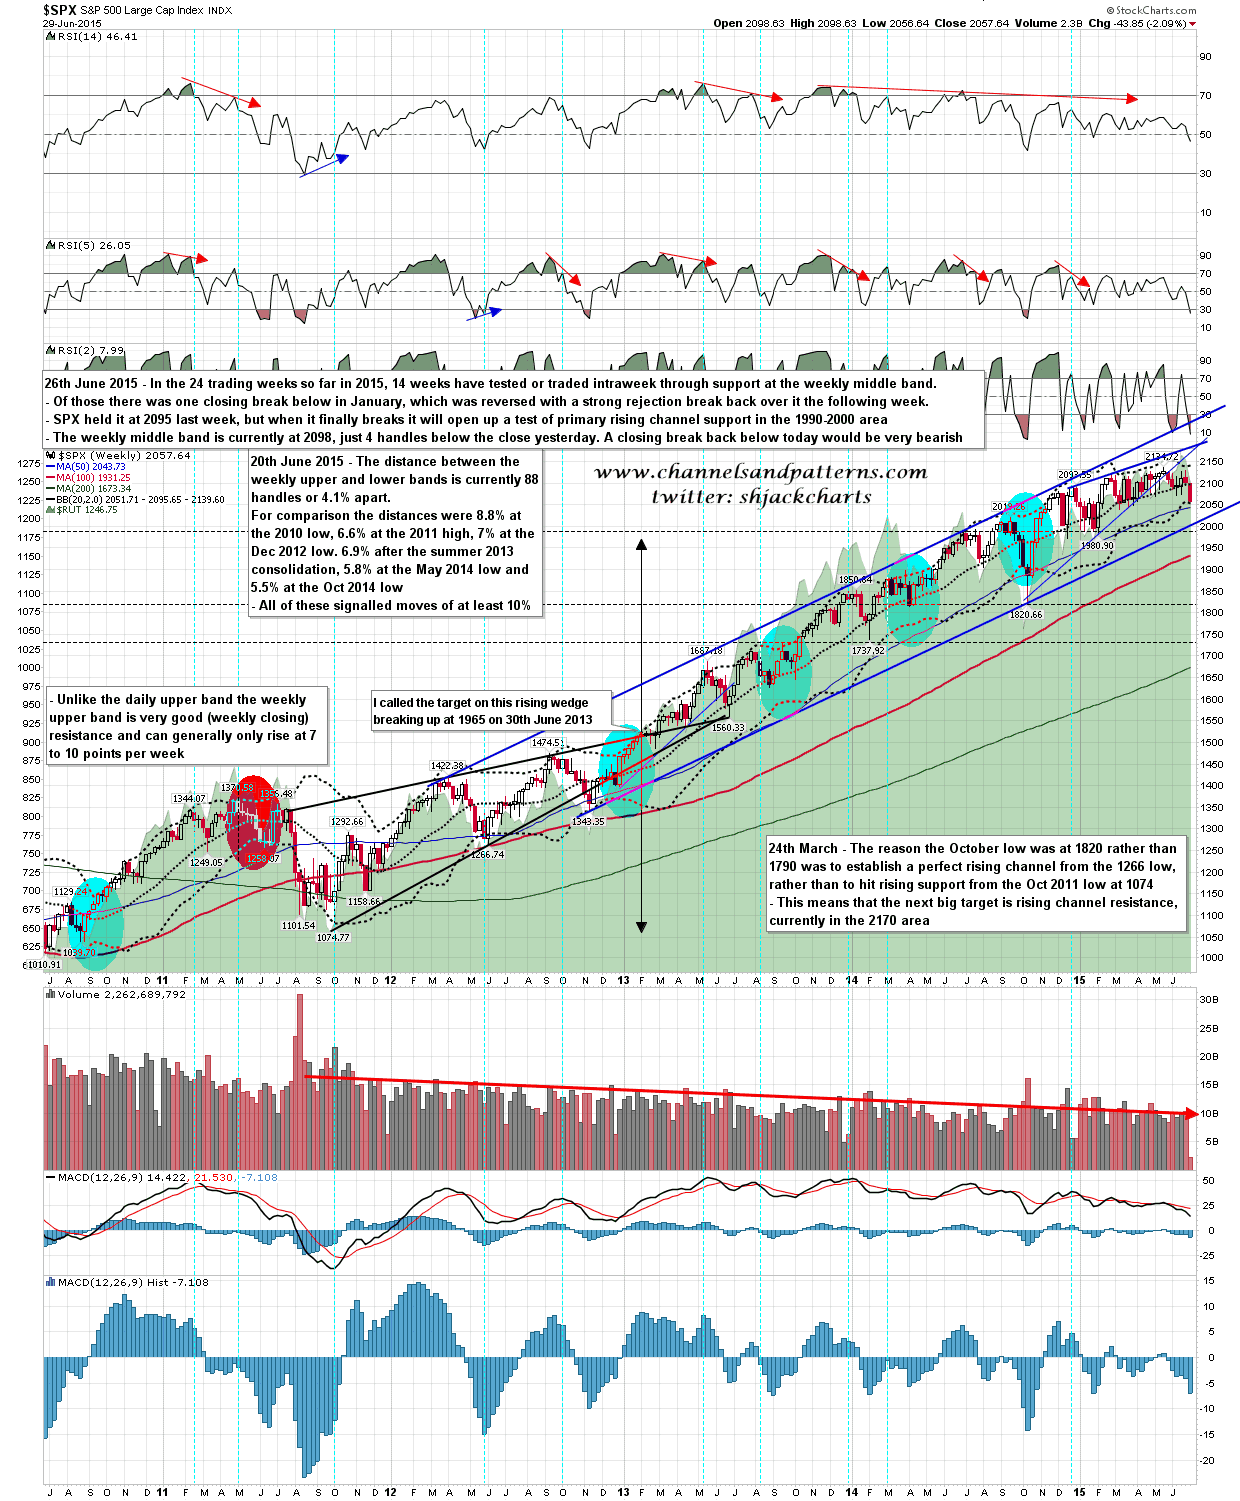
In terms of the move we are looking at now, Stan is leaning towards a low in the April area next year, so this should be a slower move than in 2011. That said the compression here over the last few weeks has been extreme, with the last ten weekly closes in the very narrow 2092 – 2126 range, and a weekly band pinch that reached what is likely to be the extreme last Friday at 80 handles or 3.8% between the lower and upper weekly bands. Apart from a run of three pinches under 4% in 1992, 3 & 4, that is the tightest weekly band pinch since 1970, and most of the band pinches under 9% resolved into moves of 10% area or more during the subsequent band expansion. That expansion should now have started on SPX. SPX weekly chart:
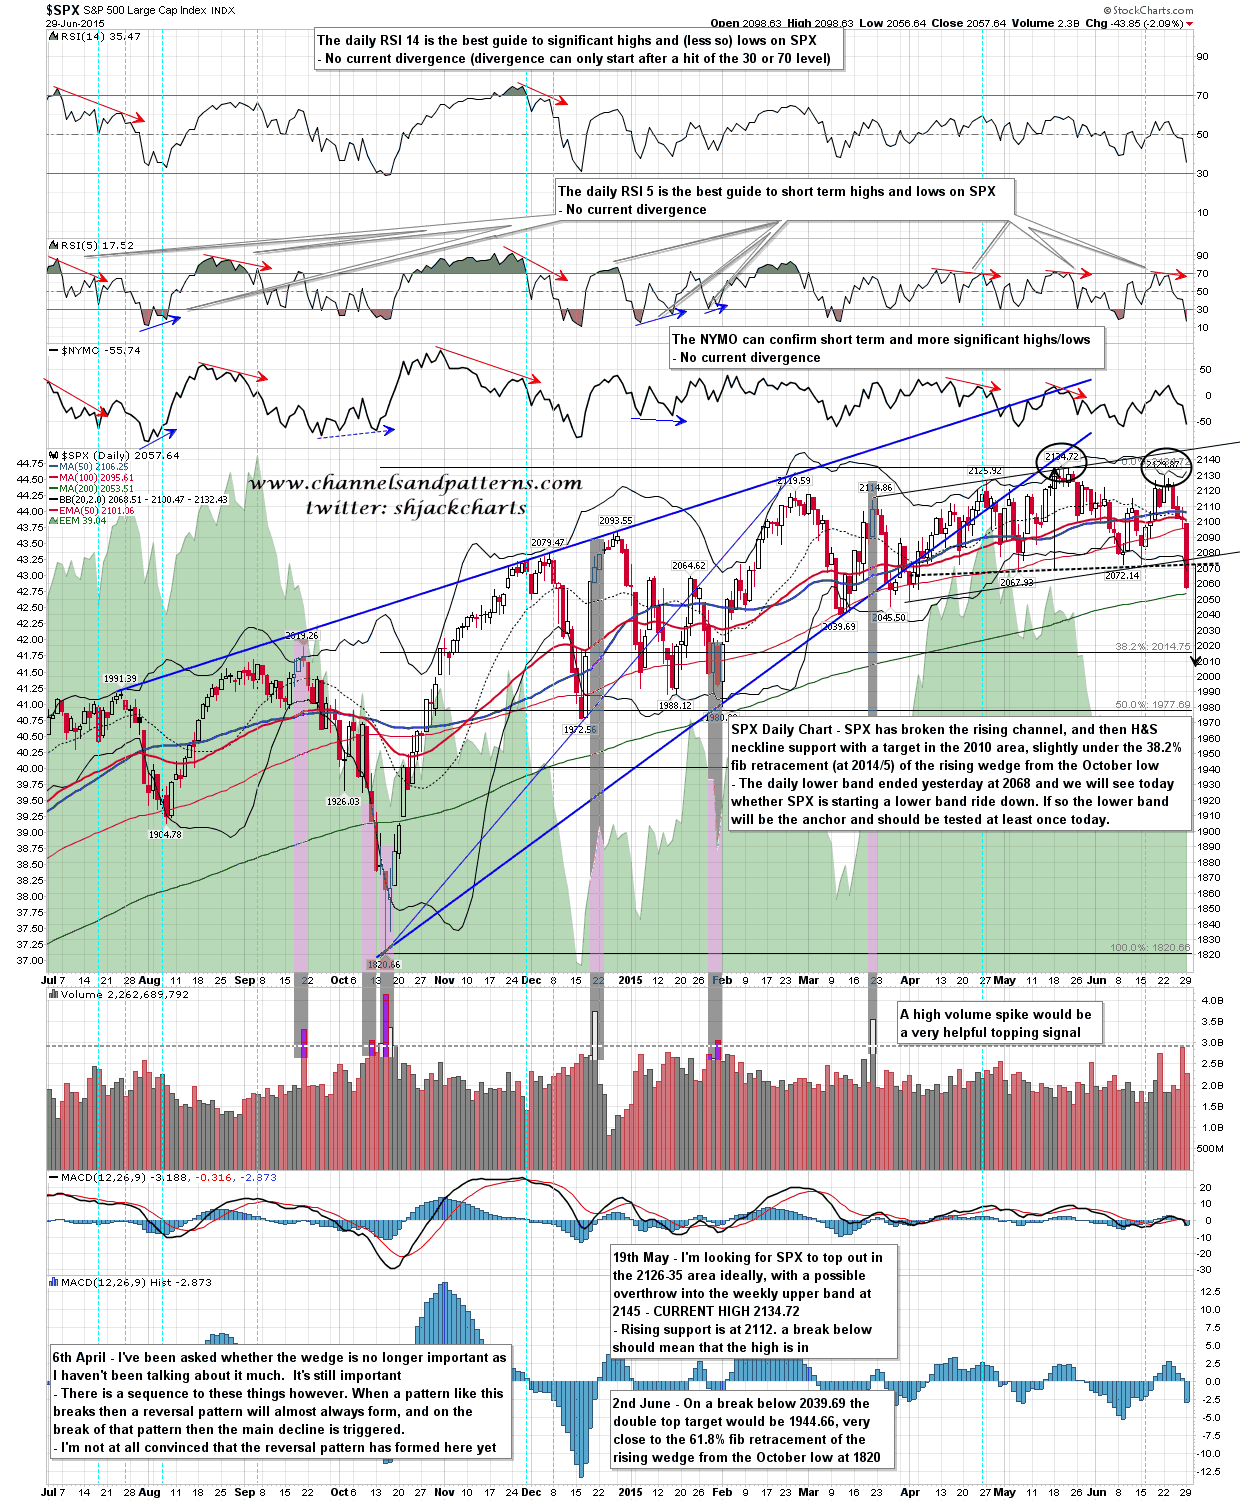
In the shorter term SPX closed twelve handles under the daily lower band yesterday and that would generally suggest some kind of bounce coming into today, though it might not be much more than the current +17 from yesterday’s close at the time of writing. I have declining resistance at the broken H&S neckline in the 2072 area, declining resistance from 2129.87 in the 2090 area, and the daily middle band at 2100. For support I have the 200 DMA at 2053, the weekly lower band at 2051, support at the March lows in the 2039-45 range, and then nothing obvious until we see a test of the 2000 area. SPX daily chart:
For today I’m hoping to get a morning high to sell hard and I think we may well get that. For a more detailed view of what Stan and I are looking at over the next few days I’d suggest watching the video Stan posted last night at our joint site theartofchart.net, as that gives a very helpful summary. You can see that here. Everyone trade safe, the next few weeks and months may get rough.
