
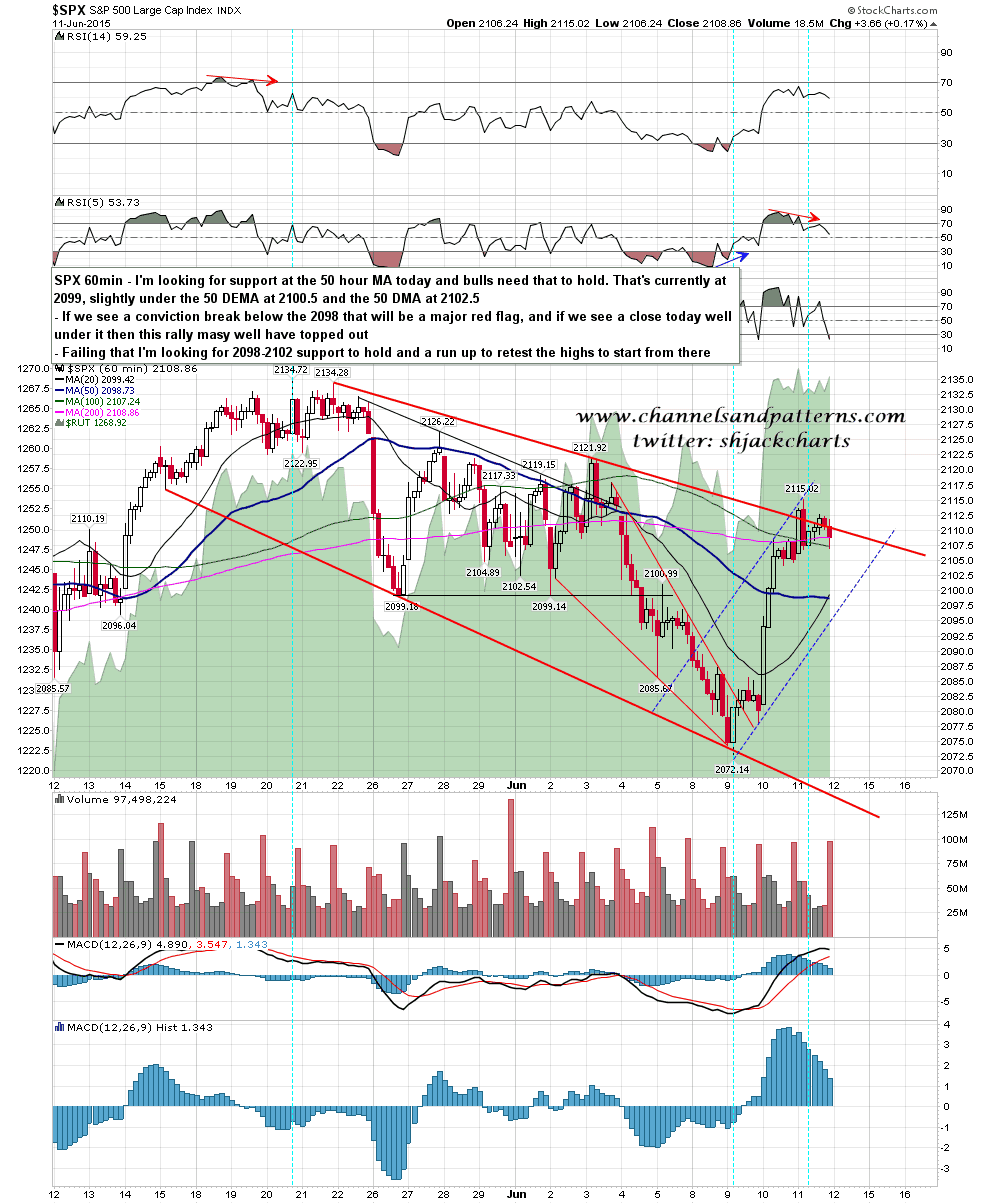
Yesterday went much as expected, with a first test of the daily middle band that failed. Overnight ES has retraced to test support, which on ES is in the 2098 (50 hour MA) to 2102.5 (50 DMA) range. If this area holds today then I would expect another attempt at the daily middle band with a break up, before a retest of the all time highs. If we instead see a hard break of support today then the picture gets a lot darker, and we might well break back down hard. SPX 60min chart:
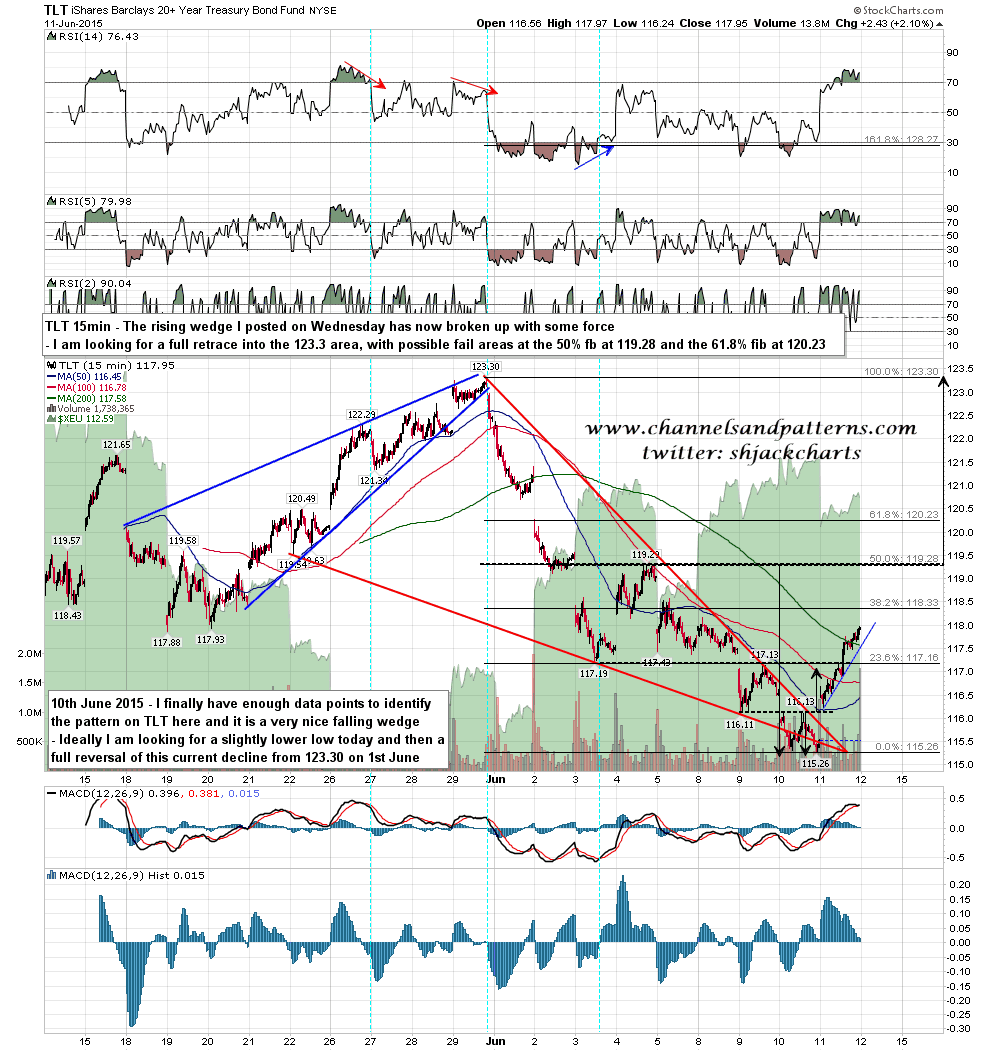
Hopefully some of you took the long on bonds I was looking at earlier this week. The falling wedge has now broken up and I’m looking for a full retrace back to 123.3, with possible fail areas at the 50% and 61.8% fibs. TLT 15min chart:
I’m expecting a short term bullish resolution today and will be looking for long entries at support. If we get the retest of the all time highs I’ll be looking for a very hard fail there. This is the retest to make the second high of a double top scenario that I was looking at on 26th May. You can see that here. I don’t think this move has any longer term bullish implications and will be adding short at the retest.
