
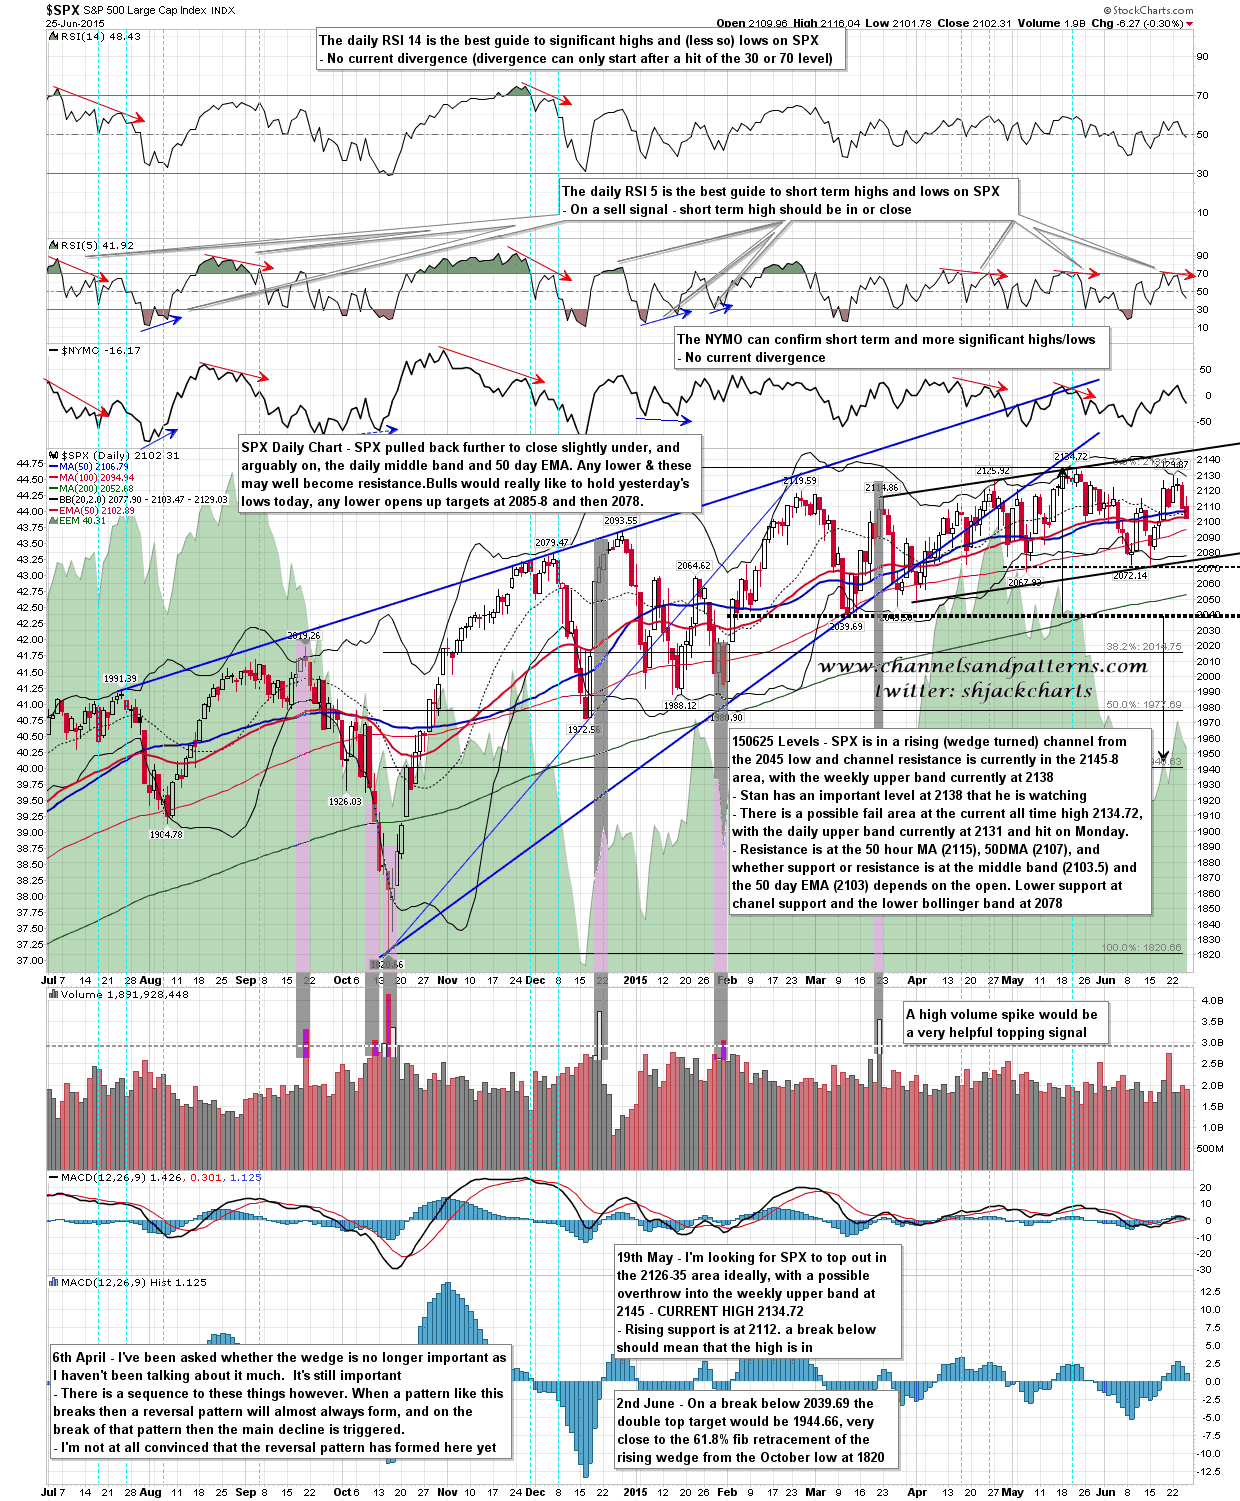
The bears turned in a second consecutive very solid day yesterday, with a fail at the 50 hour MA in the morning and a close marginally under both the daily middle band and 100 day EMA. If bears can break the low yesterday by more than a couple of handles then that opens up an H&S target at 2085-8 and below that a test of channel support and the daily lower band in the 2078 area. SPX 60min chart:

SPX daily chart:
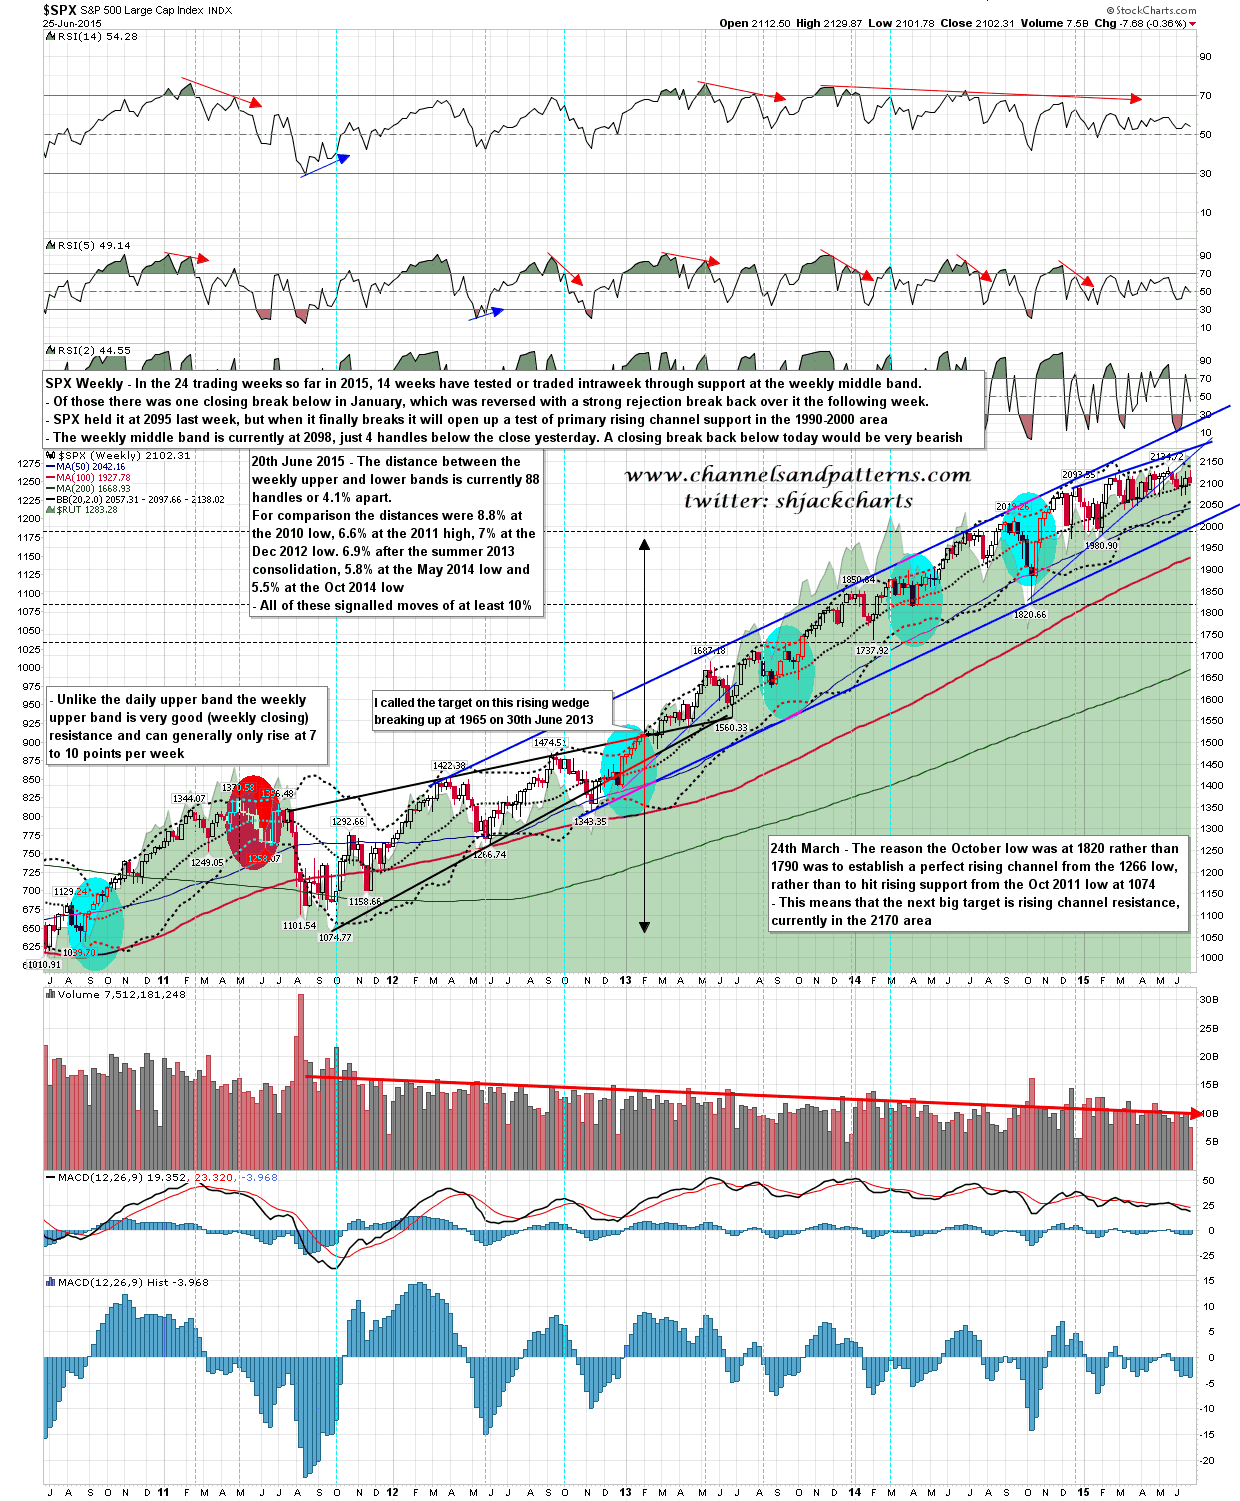
On the weekly chart there is very important closing support at the middle band in the 2098 area. a significant break below today would be extremely bearish, and likely confirmation that the intrayear high for 2015 is now in the rearview mirror. SPX weekly chart:
Bulls closed yesterday at the edge of a technical cliff, and on the gap fill and lower low at the open today they are in serious danger of falling off it. If we should see a rally today I have key resistance at the 50 hour MA in the 2115 area, and I’m doubtful about the bulls making any lasting break back over that from here.
The historical stats for today lean bullish and no theartofchart.net chart here today though I will be doing a post there later.
