
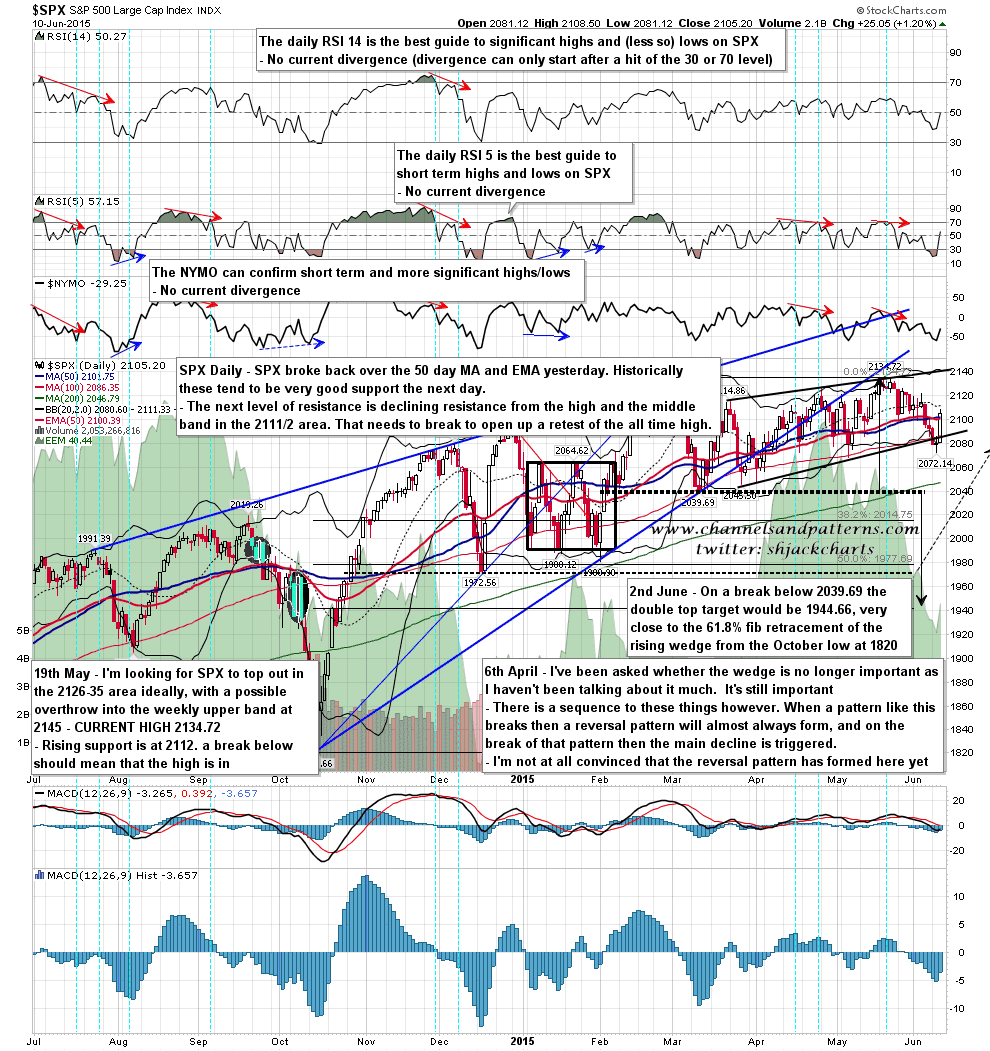
A very strong day yesterday and SPX broke and closed over the 50 hour MA and the 50- day MA and EMA. I’ve looked at the stats for tall white candles that have broken and closed over the 50 day MA and EMA in the last year and there have been eleven. Of those eleven only one closed below both the next day and that was marginal. Six never even retested them as support. They closed at 2100/1 and that may well therefore be very strong support today.
If these hold on a retest, which I’m expecting them to do, then the next level of resistance that the bulls need to break is at the daily middle band and declining resistance from the high at 2111/2. A close back over this level with any confidence opens up a retest of the all time high at 2134. SPX daily chart:
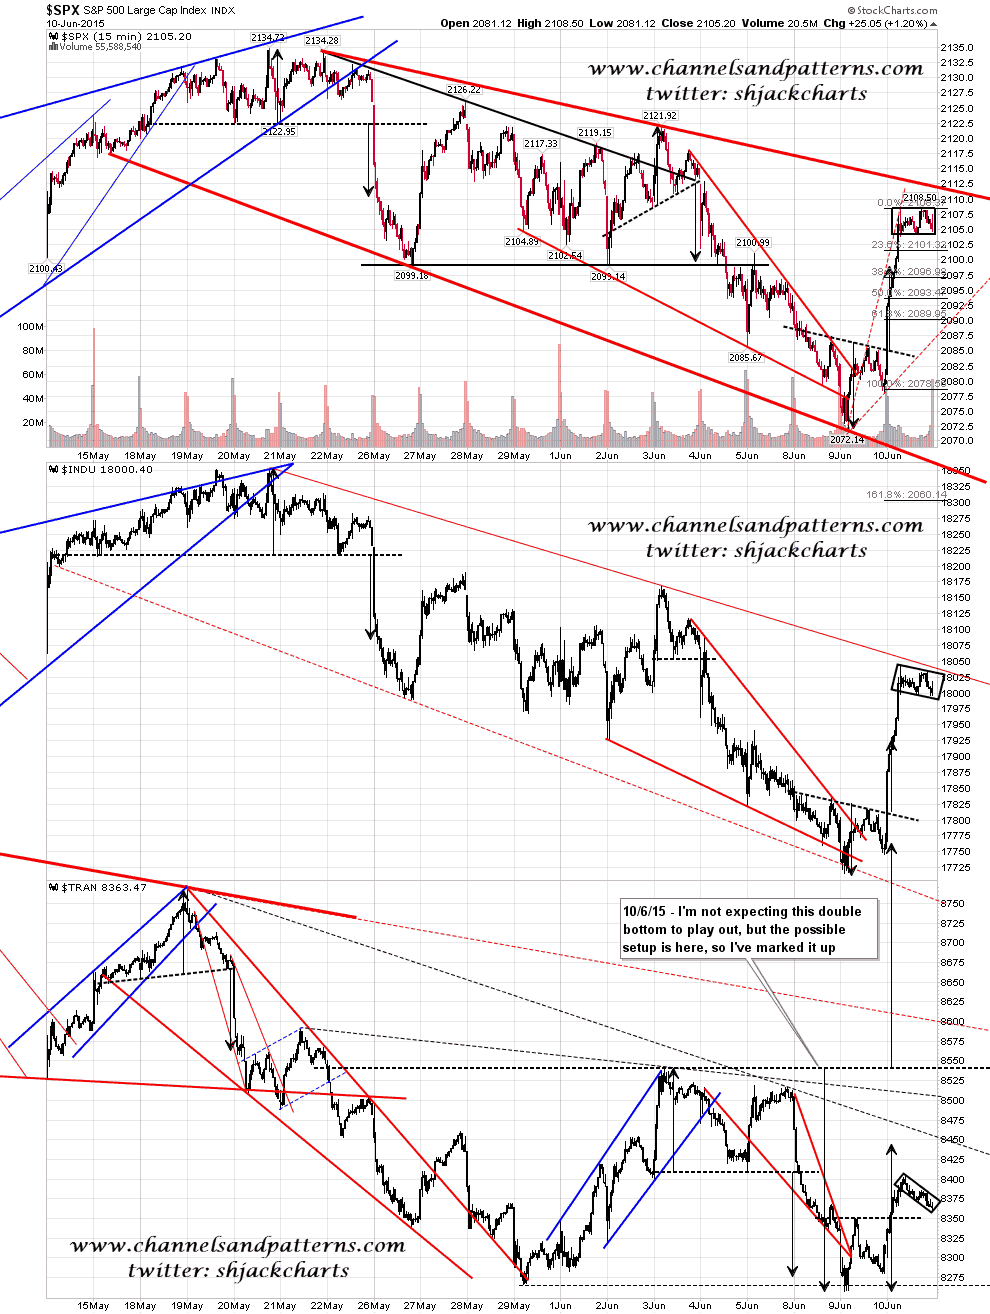
All the reversal patterns that I posted yesterday morning had made their targets by the close yesterday, as had the fixed 15min buy signal that I mentioned. The SPX chart below illustrates why the 2111/2 area is important here at it is (70% bullish) falling megaphone resistance. Scan 3x 15min SPX INDU TRAN charts:
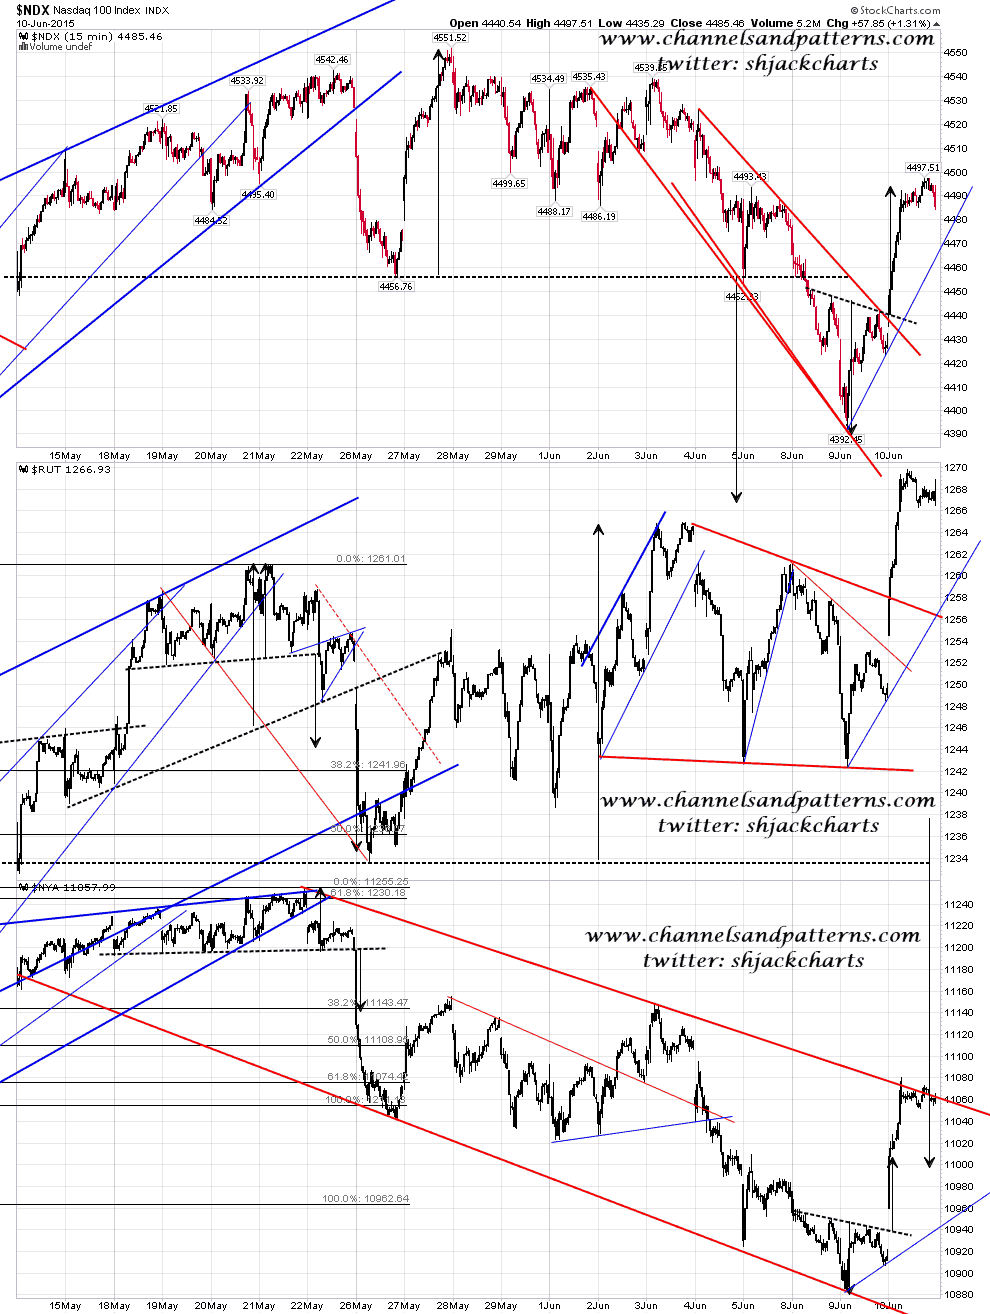
Scan 3x 15min NDX RUT NYA charts:
I’m expecting some kind of retracement to start today, and I’m doubtful about seeing any break of strong resistance turned support at 2000/1. That retrace low should be a good buying opportunity. for a run back into a retest of the all time high, and the very likely fail there.
