Well, today sucked out loud for the bears. Lifetime highs on the NASDAQ as well as the Russell 2000, all in the midst of the Greek nonsense which is persistently at the cusp of blowing up, but never does. One wonders what the market would do if an honest-to-God deal actually was announced, as opposed to simply rumor after rumor after rumor.
In spite of this, there are still a lot of interesting charts from a technical analysis basis. I thought I’d share three.
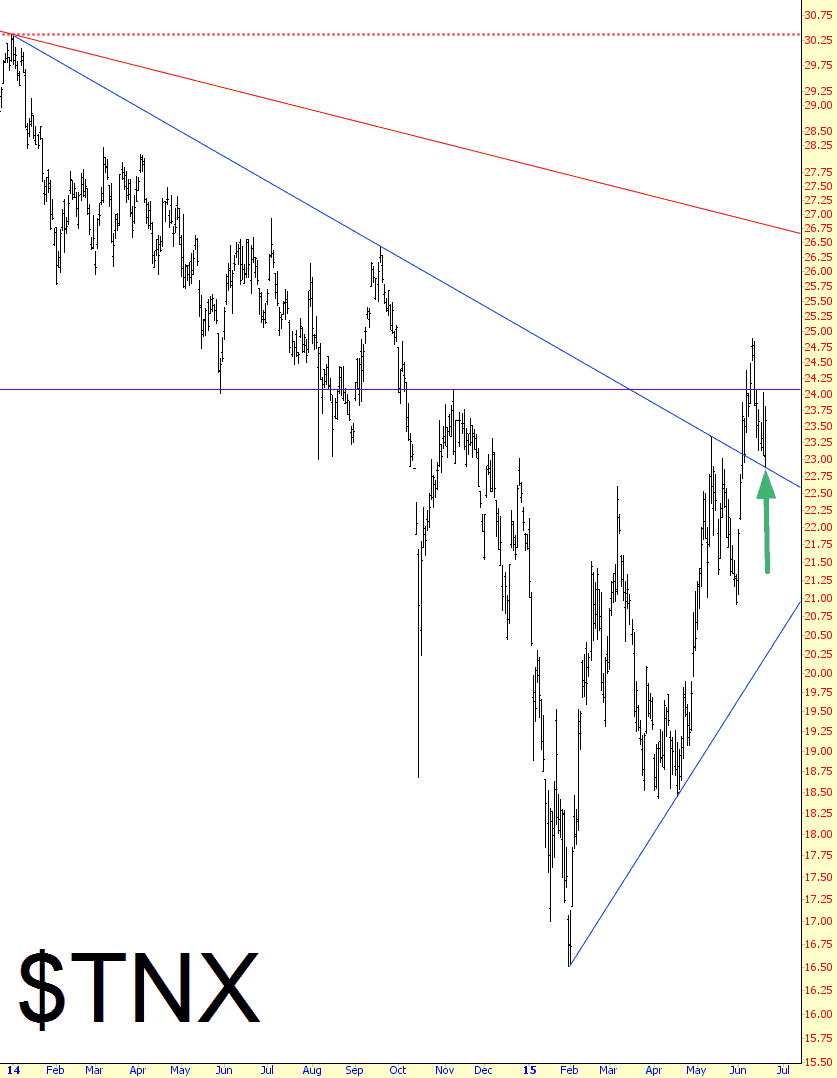
The first is $TNX, which is the 10-year note interest rate. This one has been fascinating, because it was suppressed by its resistance trendline (shown below in blue) for many, many months until it broke out on June 3rd. Today is did precisely what it was supposed to do: fall, but not break beneath, the exact same trendline, confirming the line’s new role as support instead of resistance. Assuming this line continues to hold, I think an interest rate rally is in the cards.
Conversely, there’s the gold bugs index. Instead of an uptrend (as with interest rates, above), this is the confirmation of a downtrend. Its supporting trendline failed, and even though precious metals and miners rallied this morning, the high of the day merely tagged the underside of the broken trendline (thus affirming its role as resistance).

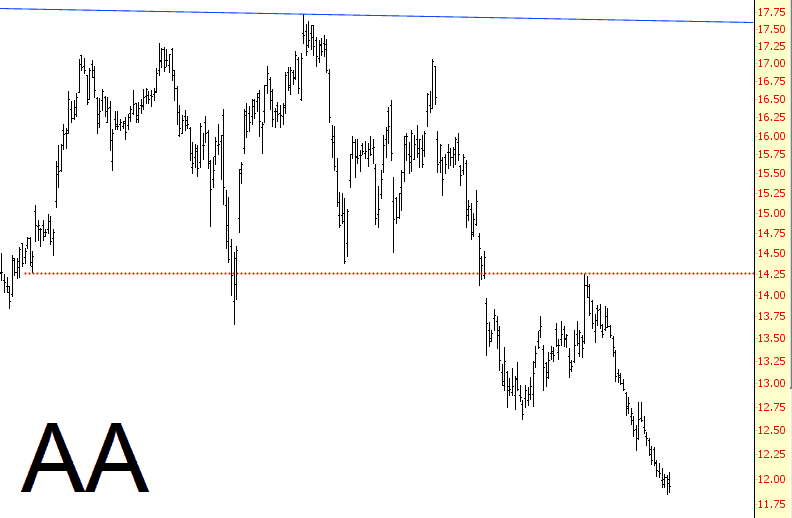
Finally, there’s “old faithful”, Alcoa, which I pointed out as a short idea on April 9th (and it has fallen over 12% since then, which is pretty amazing, considering the straight-up market we’re in). The analog continues to play out beautifully, and AA could be in its own bear market for years to come. (As an aside, I would mention that symbol SQM, mentioned repeatedly as a short on Tastytrade as well as weekend videos, took a 13%+ tumble today – – another occasional winner!)