
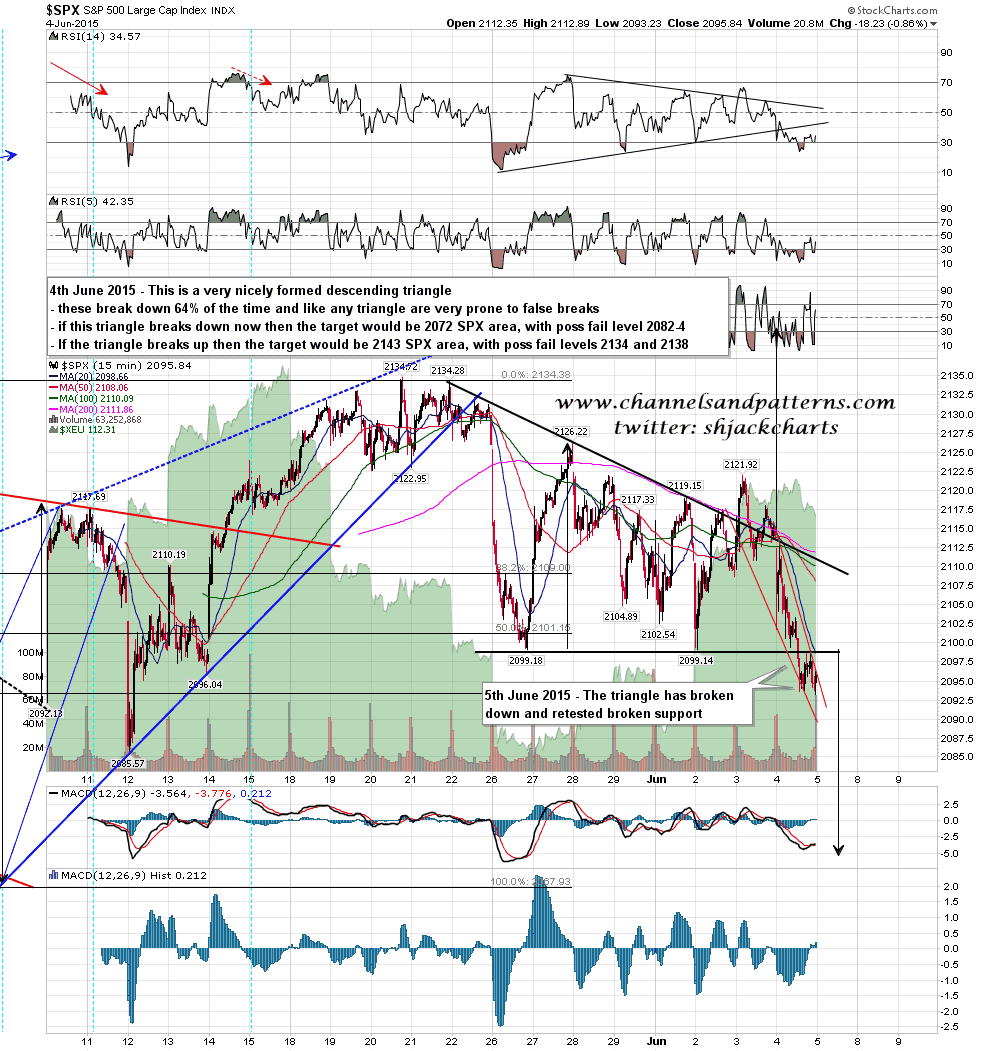
Bears had a solid day yesterday, breaking and closing below the 50 day MA, 50 day EMA and triangle support. Broken triangle support was perfectly retested and held. The full triangle target is in the 1972 area, and if SPX fails to get back over 2000 today, then I have a flag target there as well.
Important support levels on the way to that target are the daily lower and weekly middle bands at 2087-9, and the 100 day MA and rising wedge support from 2045 in the 2083-6 range. If SPX is going to fail to make the triangle target, then I would expect the fail to be at the rising wedge support in the 2085 area, and if SPX should touch and reverse there, then SPX could well retest the highs and perhaps make a slightly higher all time high within that rising wedge. If the rising wedge support breaks, then that opens up the full triangle target in the 2072/3 area,. SPX 15min chart:
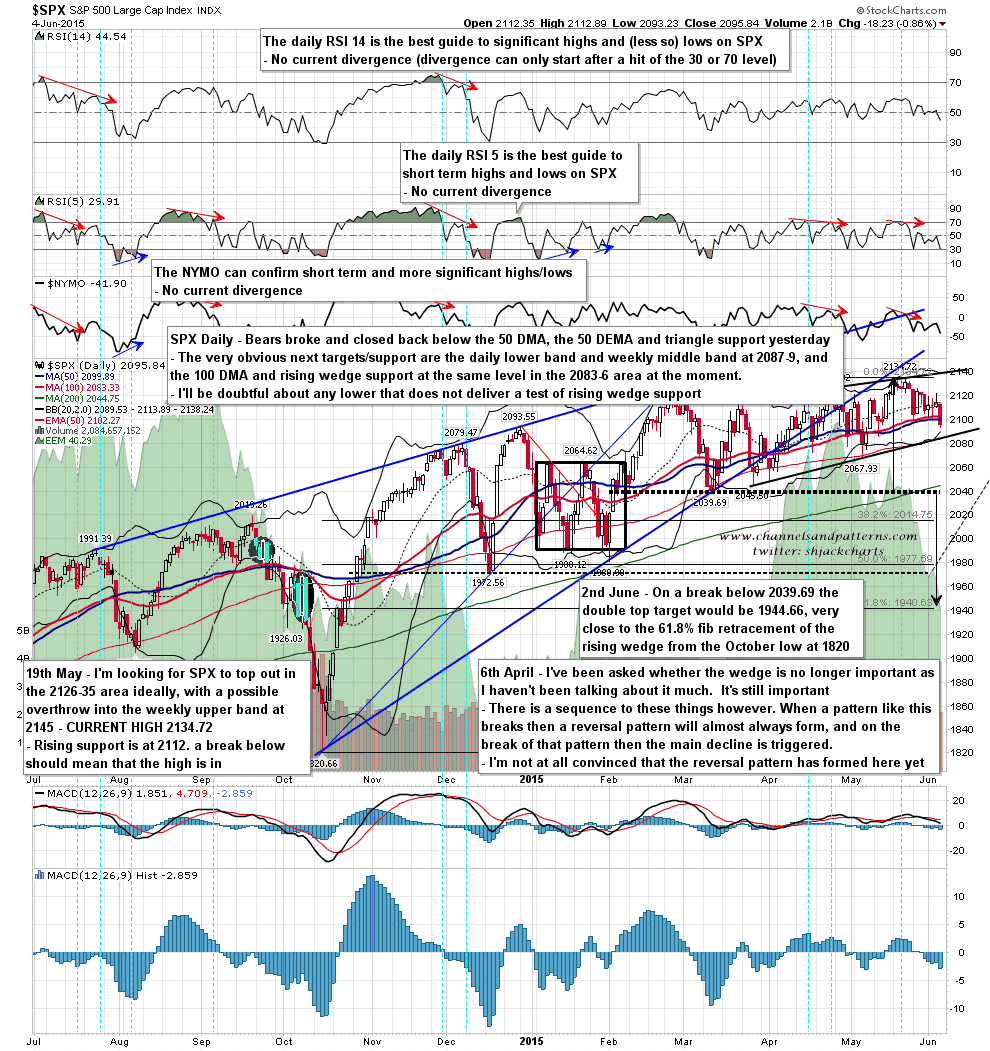
SPX daily chart:
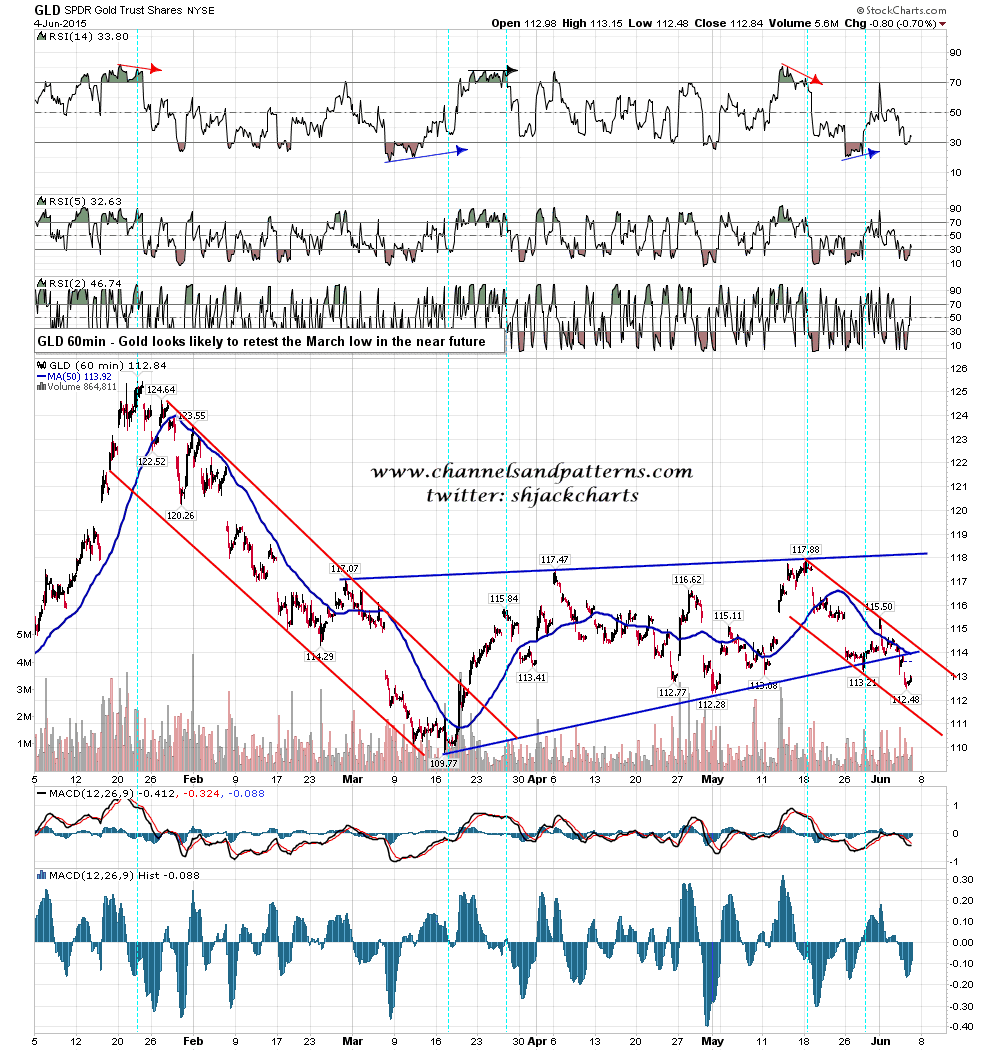
GC has broken down from a two month rising wedge and the next obvious target for gold is therefore a retest of the March low at 1141. GC 60min chart:
I have been working on the loose assumption that SPX would test the 2085 area today and then most likely retest the highs. If we see that wedge support trendline break, then we could well see a daily lower band ride to test main double top support in the 1939 area, so I’ll be watching that carefully.
