
Slope of Hope Blog Posts
Slope initially began as a blog, so this is where most of the website’s content resides. Here we have tens of thousands of posts dating back over a decade. These are listed in reverse chronological order. Click on any category icon below to see posts tagged with that particular subject, or click on a word in the category cloud on the right side of the screen for more specific choices.
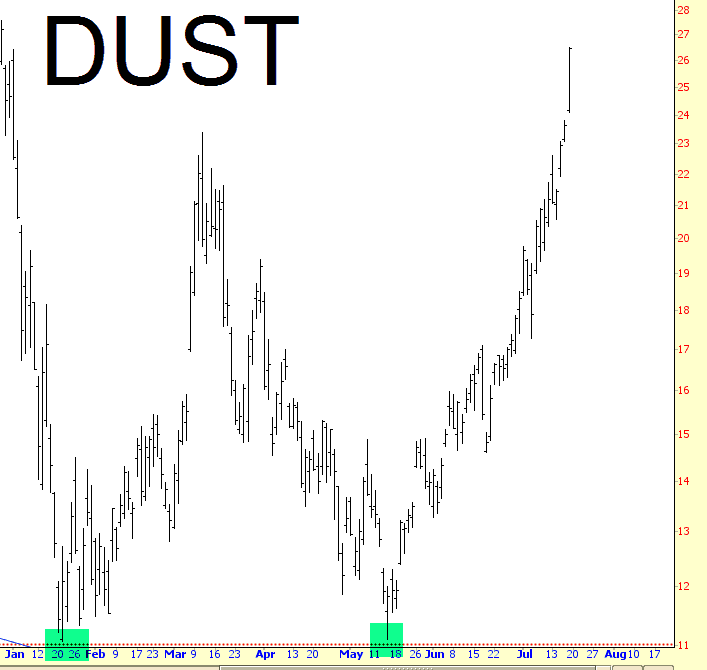
Left in the DUST
As precious metals suckitude asserts itself around the globe, double-bearish-on-miners ETF symbol DUST has exploded from a double-bottom just a couple of months ago for gains of about 170%. This one really one that got away, and I specifically mentioned the double bottom on my TastyTrade show. I suspect miners are going to continue to be weak for months to come.
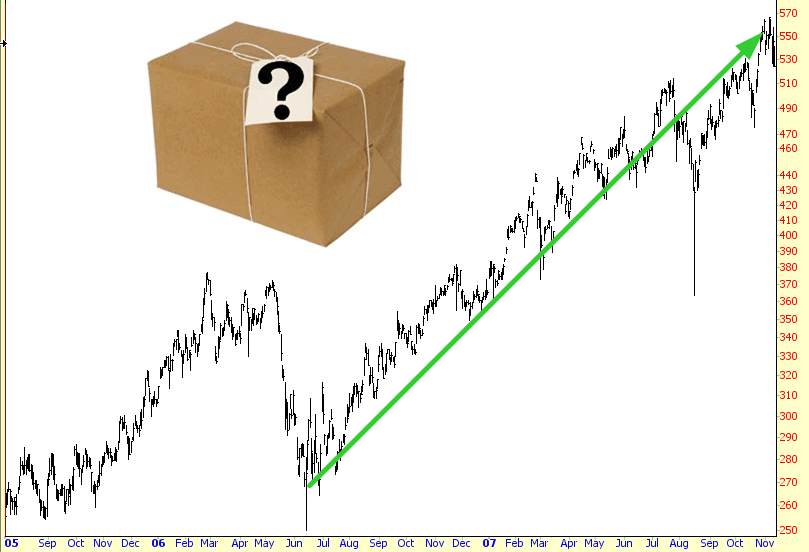
A Powerful Equity
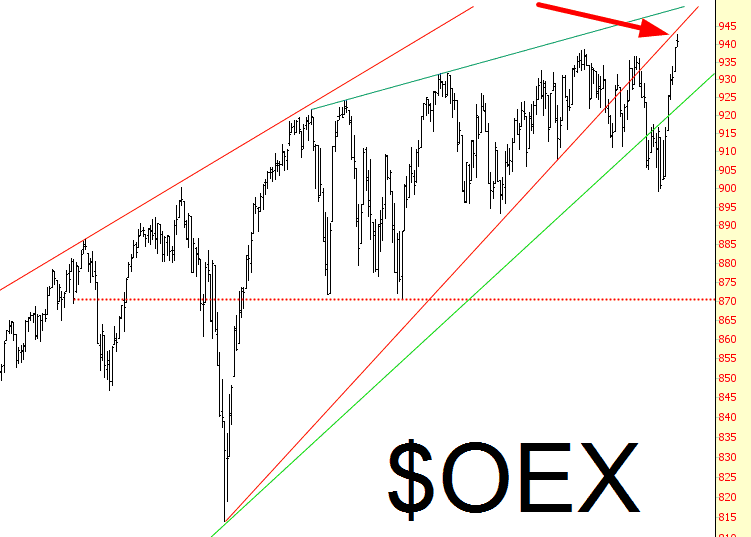
S&P 100 at PERFECT Wedge Resistance
Were it not for the trauma of the past six years, an objective technician would sell his overpriced Palo Alto house, put it all into OEX November puts, and prepare to make tens of millions of dollars. As it is, I’ll just share the chart.
July Opex
Another day of grinding up yesterday and it’s possible that we’ll see the same today, though Dow has been down nine of the last fourteen July Opexes and SPX has been down six of the last seven Fridays (stats courtesy of the Stock Trader’s Almanac, and Cobra’s Market View). If not today then the historical stats for Monday are bullish and the stats for Tuesday and Wednesday next week are bearish.
The optic run charts are now more clearly bearish than they were yesterday. There are now well established resistance trendlines on SPX, INDU and TRAN, and I have sketched in possible channel support trendlines for the coming retrace, if we are seeing channels form rather than wedges or megaphones. Scan 3x 15min SPX INDU TRAN charts:

I have a decent looking rising wedge on NDX, nothing worth mentioning on RUT except a possible double top forming & not much reliable on NYA. All indices except TRAN have made their double bottom targets and made their buy signals targets. All indices except NDX have possible 60min and/or daily RSI 5 sell signals brewing. Scan 3x 15min NDX RUT NYA charts:

We should find out today whether we are going to see a retracement/reversal from yesterday’s highs or are going to push up into a full retest of the all time high at 2134.72. On a move over the last significant high at 2129.87 I’ll be looking for that full retest.
I’m on holiday next week but I’ll be trying to post at least one chart every morning with comments. Stan will be posting his usual Monday, Wednesday and Friday video updates at theartofchart.net and I’d suggest looking at those too. If you follow the blog then you will receive posts there by email within minutes of them being posted. Stan’s post there today is well worth a look and you can see that here. everyone have a great weekend 🙂
