
Stan and I were looking carefully at the current setup on SPX in yesterday’s chart chat and you can see the recording of that here. Short term SPX and the rest of my optic run indices are still in the same inflection point that they were in on Friday morning, waiting for a break either way.
If that break is upwards then the very obvious target is the 2030 area, at the retest of broken channel support, the target for the retrace of the triangle from two weeks ago, and not far below the SPX double bottom target at 2041.
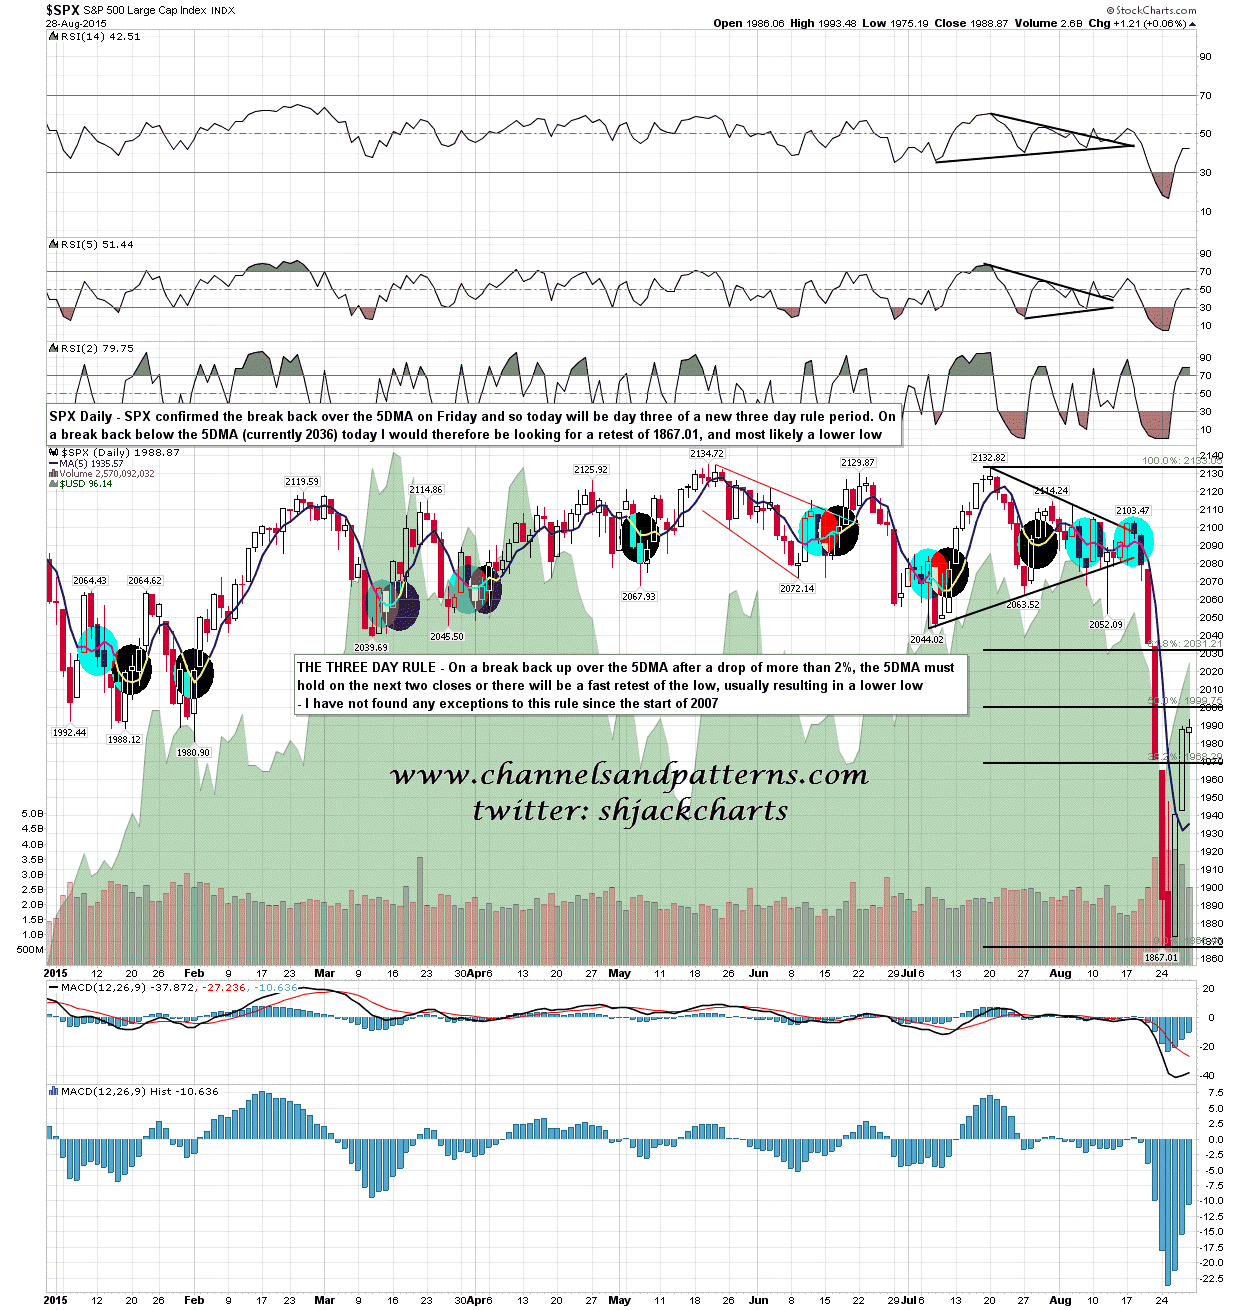
If this breaks down instead the first sign will be the break below Friday’s intraday low at 1975.19. That was retested on Friday and, if not broken today, should be a floor while this rally continues. Next support would be short term double top support at 1948.33, and a break below that would fix a double top target in the 1903 area. That would need to be confirmed by a break of 1940.51, which would fill Thursday morning’s unfilled breakaway gap. If we were to see a daily closing break below the 5 day MA, then on my 5DMA stats I would expect to see a retest of the 1867.01 low with most likely a break below that. I have no fails yet on this 5DMA stat since the start of 2007, so that would be very high probability. SPX daily 5DMA chart:
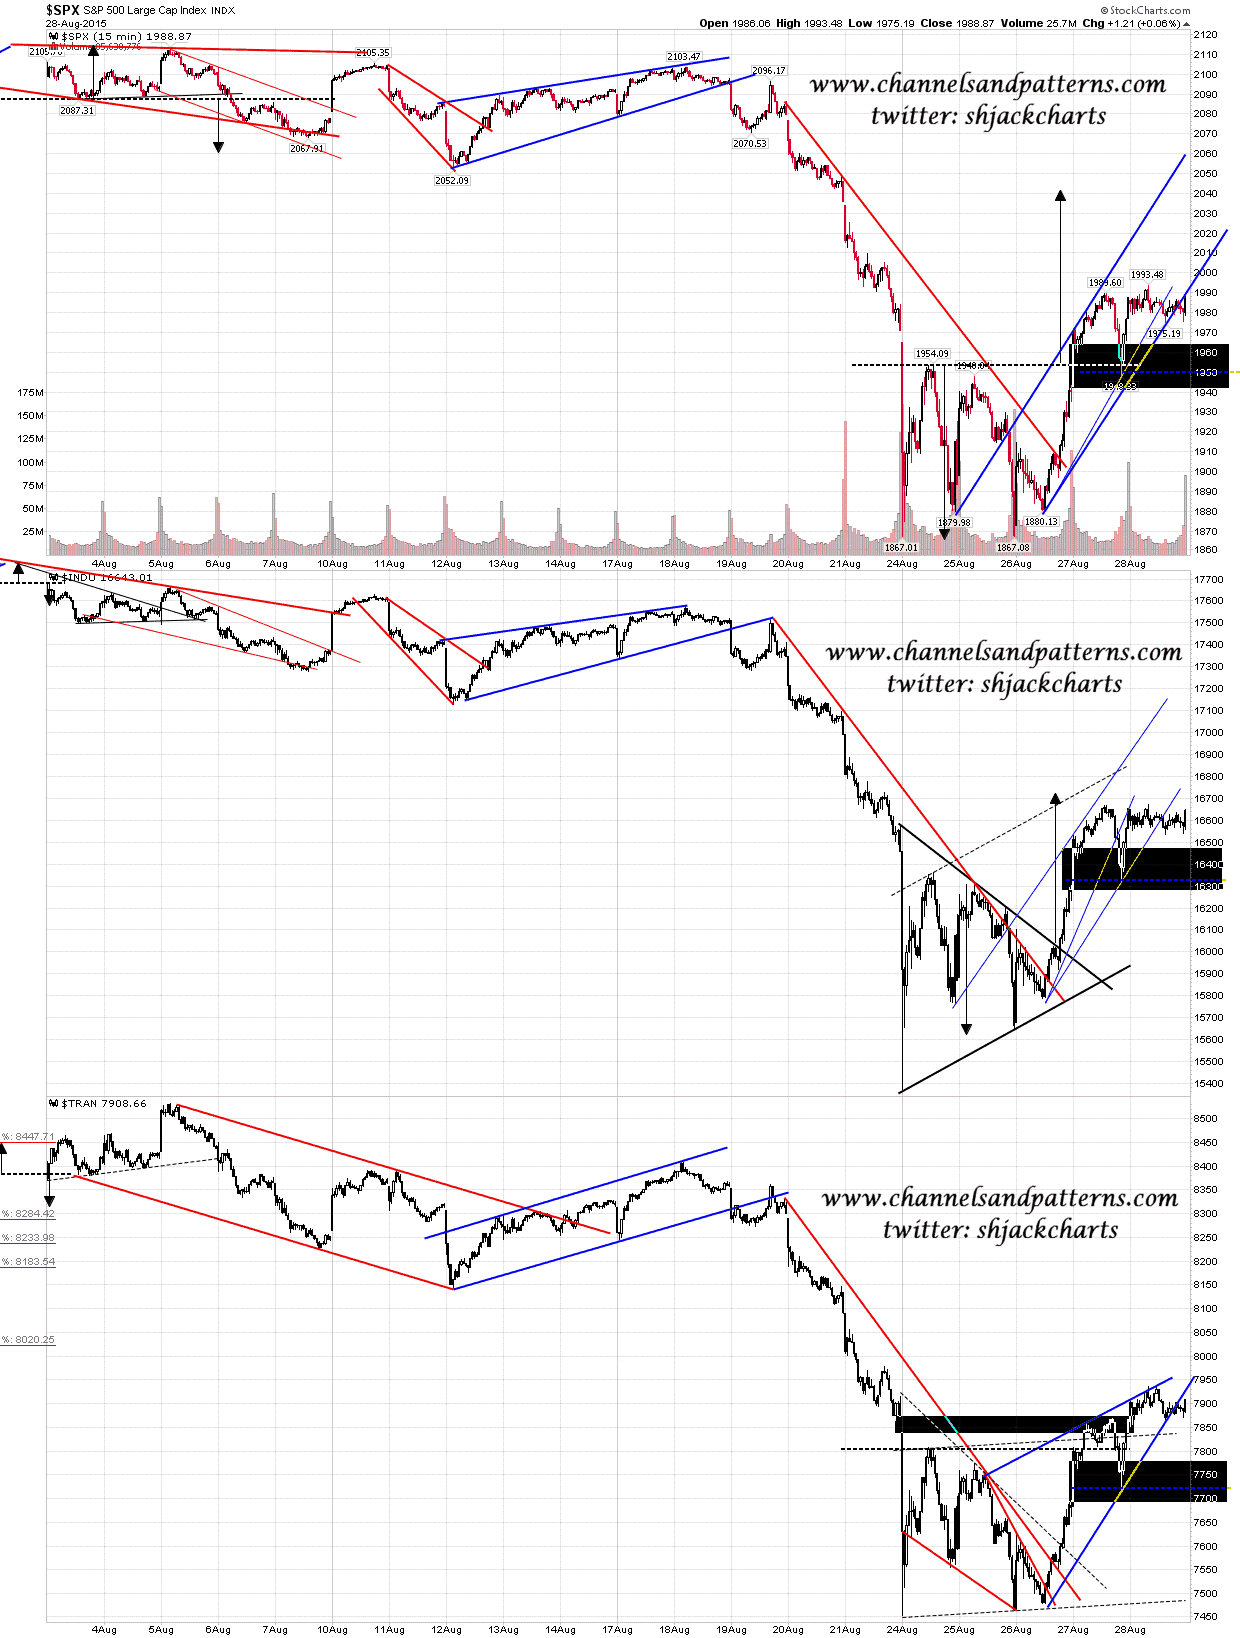
In terms of the pattern structure here none of my optic run indices can hold a support trendline yet and two of them, SPX and TRAN, have formed decent patterns that have broken down and retested. We may well see those patterns follow through to the downside. Scan 3x 15min SPX INDU TRAN charts:
Scan 3x 15min NDX RUT NYA charts:
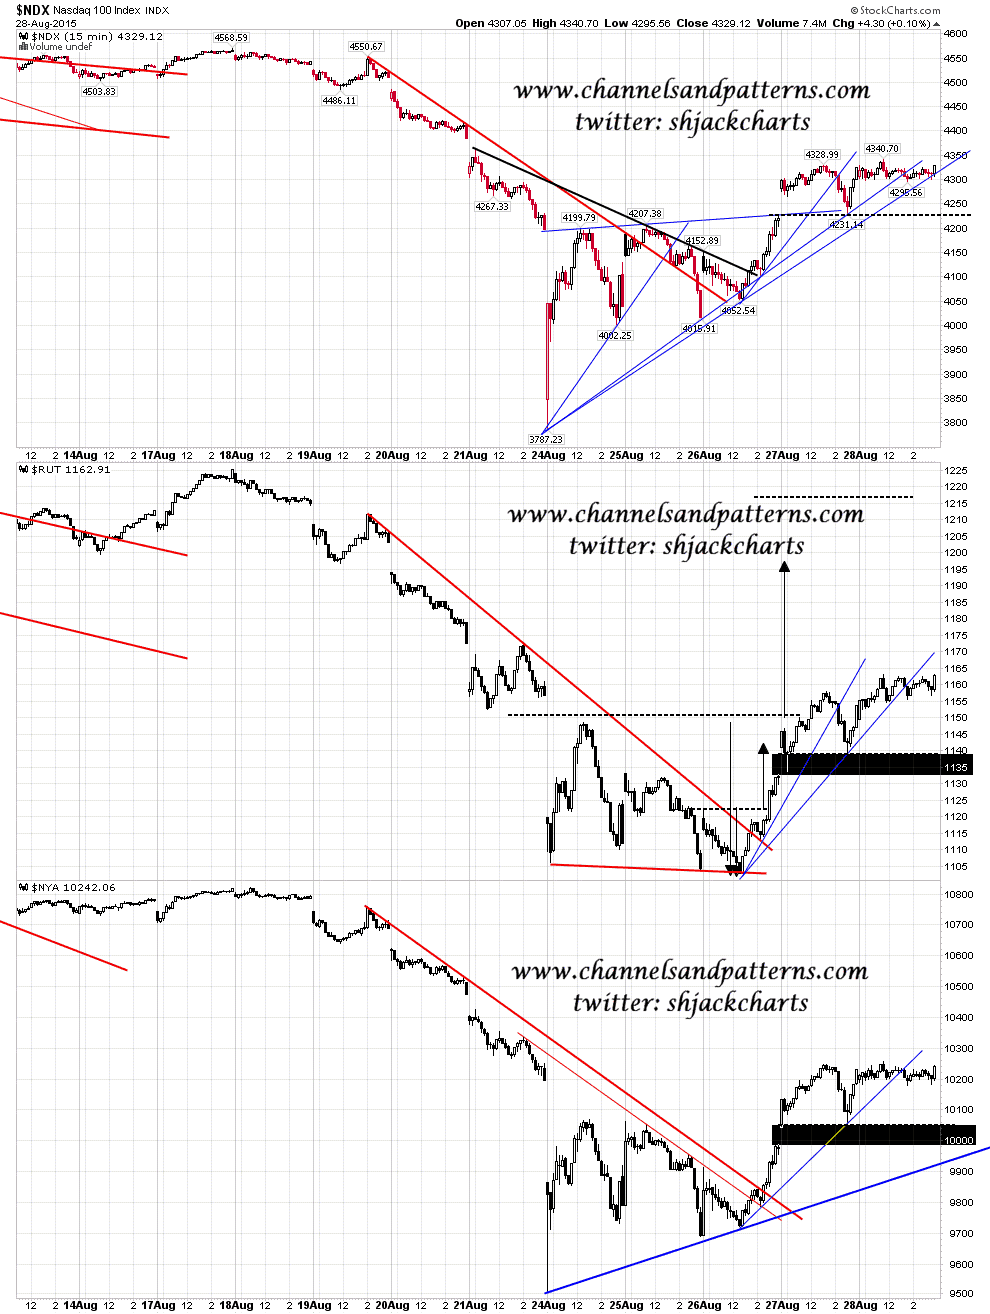
When a double bottom fails there will generally be a double top that has formed and plays out to kill the double bottom. There are clear short term double top setups on all of my optic run indices and we’ll have to see which way SPX breaks today. I have a slight bearish lean but this could very much go either way. The stats for today are neutral and the stats for tomorrow lean bullish.
