
That was an amazing day yesterday, and the close near the (SPX) lows delivered a second straight daily close well under the 3SD daily lower band, a feat not equalled in the 1987 crash, the 1994 bonds crash, the 1997 Asian Crisis, the 1998 Russian Crisis and collapse of LCTM, the 2000 Tech Crash or the Lehman Brothers in 2008. Why? Not sure yet though Shanghai falling to a level last seen six months ago doesn’t seem like a great reason.
Hat tip to my option trader friend Yousuf Hamid here for his prediction to me at the weekend that the next move would be a hard and fast fall to 1820. Nice call mate.
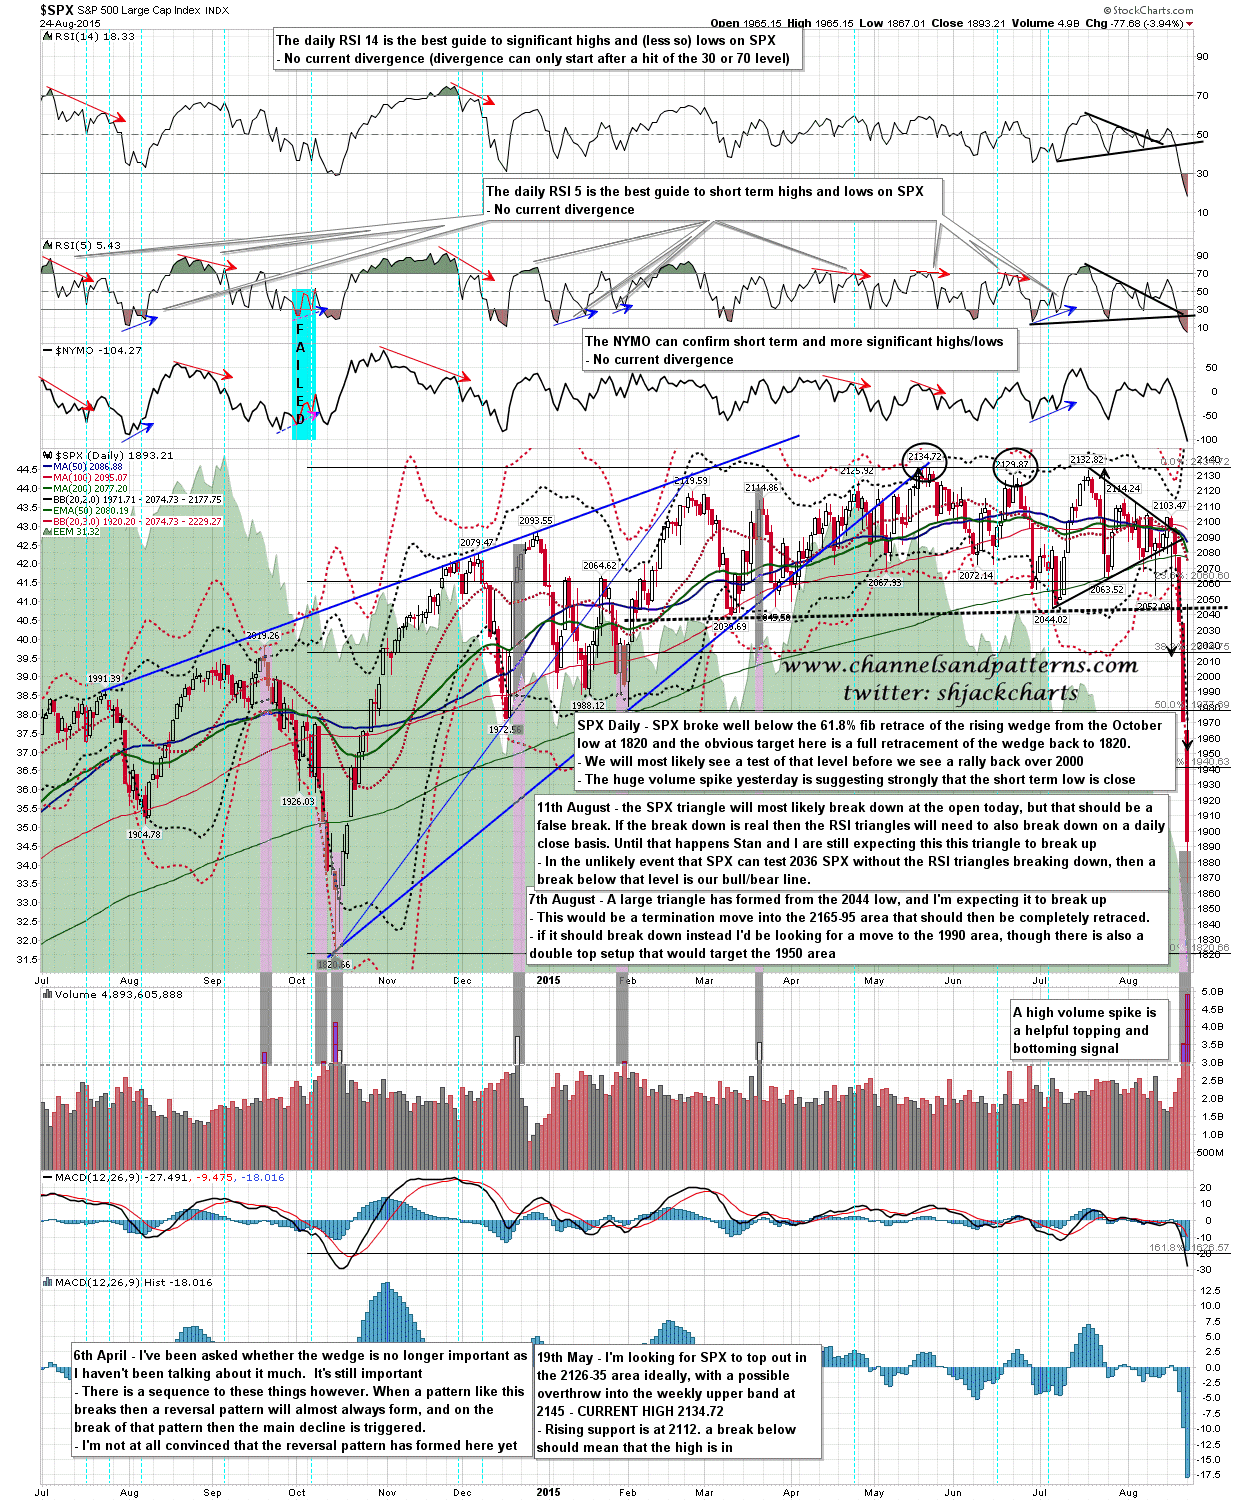
SPX broke far below the 61.8% fib retrace of the rising wedge from the October low at 1820. That makes 1820 the obvious target for the current move and if that is going to be tested I’d expect that today or tomorrow. I would also draw your attention to the huge volume spike yesterday that was the largest in the last year and considerably larger than the spike seen at the October low. A meaningful low should not be more than a day or two away. If we see a lower low I’ll be watching the 60min chart for positive divergence. SPX daily chart:
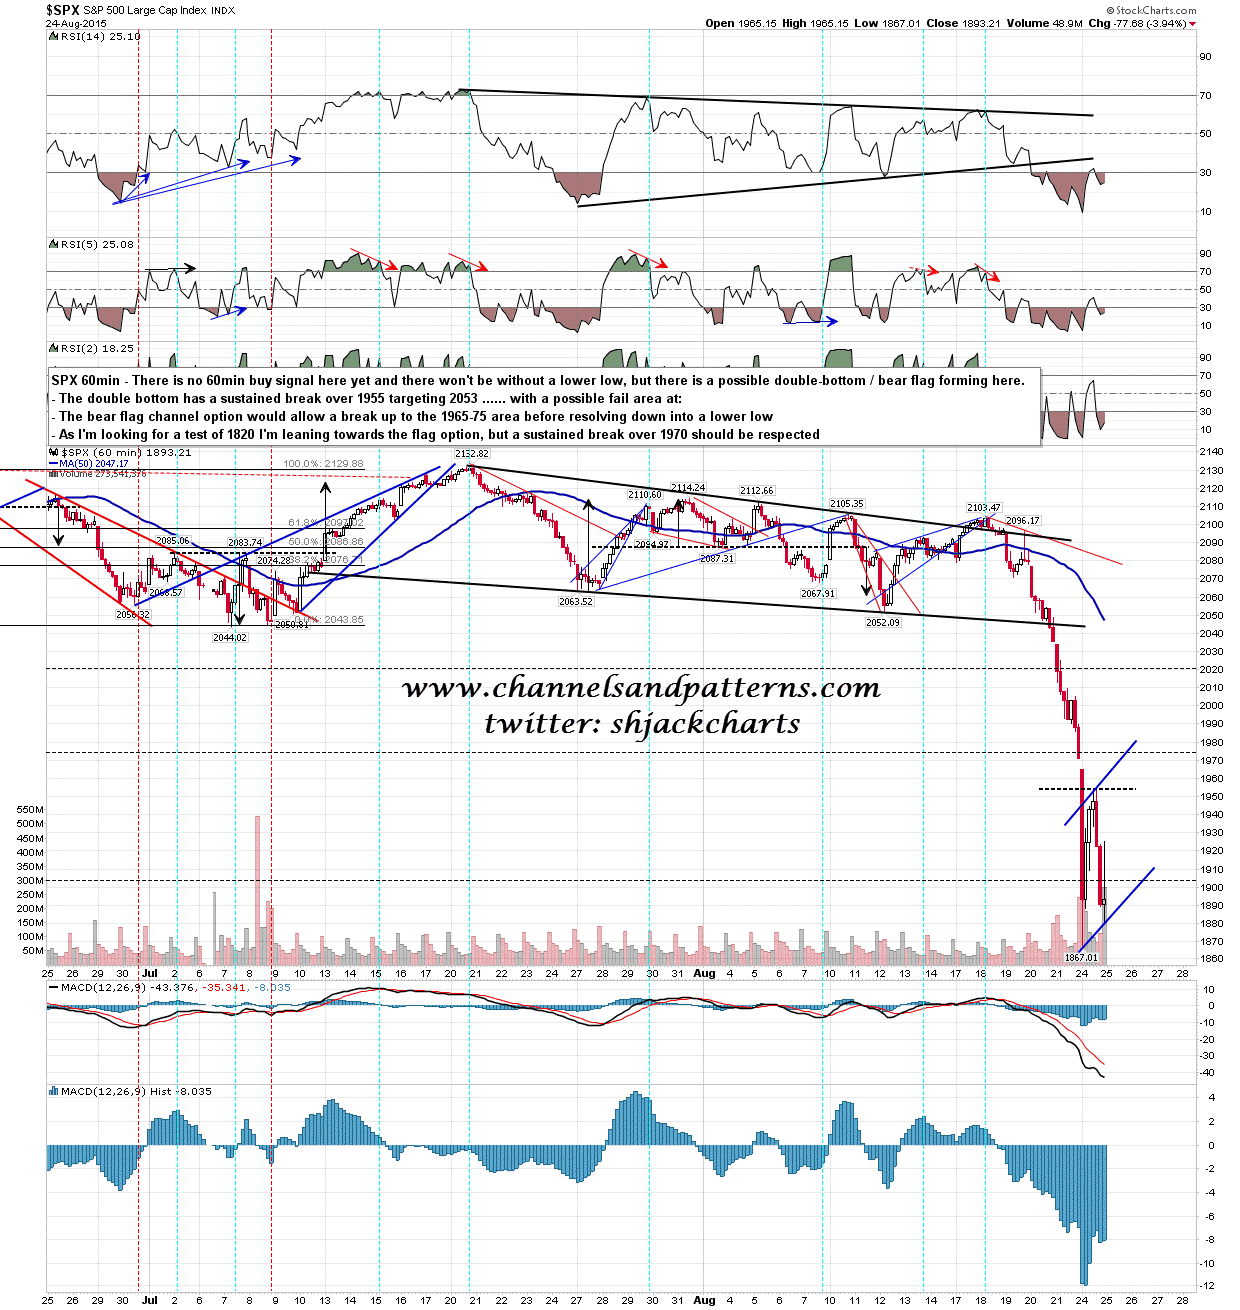
Short term I have two options for an AM high and fail today. The first is possible double bottom resistance in the 1955 area. On a break above I’d be looking for 2053. The double bottom could be a bear flag however. If that formed a bear flag channel I’d be looking for resistance in the 1965-75 area and then a fail into new lows. SPX 60min chart:
It’s going to be whippy today. Trade safe. Intraday this is a market for the quick and the dead. If you aren’t quick then it may be worth taking the day off.
