
I was saying on twitter last night after the bulls failed to recover to the 5DMA at the close that the 5DMA three day rule that I posted yesterday morning is a really strong stat. No stat can deliver all the time, but I haven’t actually found a fail on this one yet, though I may well find one when I look back further than 2007. At some point this stat will fail but that’s not likely to be today. SPX 5DMA chart:

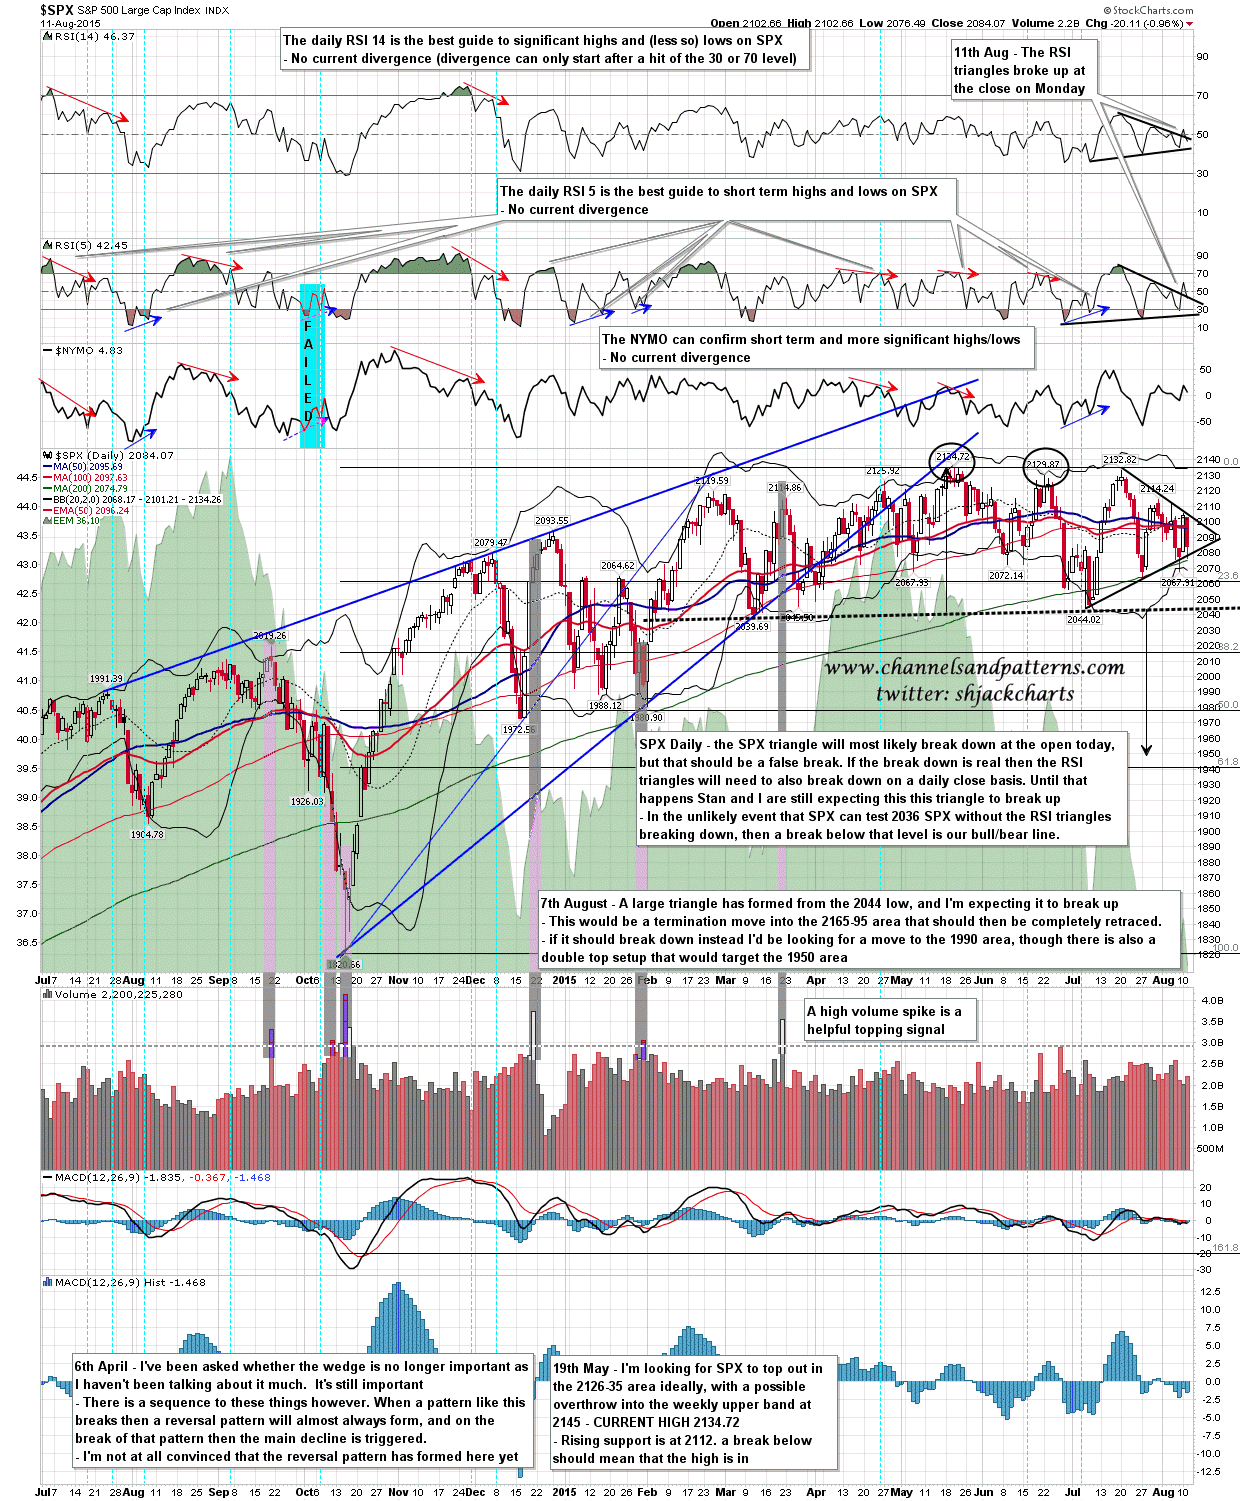
One thing that this retest of Friday’s low doesn’t mean however is that the triangle on SPX is going to break down. The chances of a break down have increased, and the support trendline on the SPX triangle may well break down today, but there a lot of false breaks on triangles, and this one is still more likely to break up until we see a break of triangle support on a daily closing basis on the RSI triangles. Until that happens Stan and I are assuming that this is a false break before the real break up. Only that RSI break or a break below 2036 invalidates the bull scenario here. SPX daily chart:
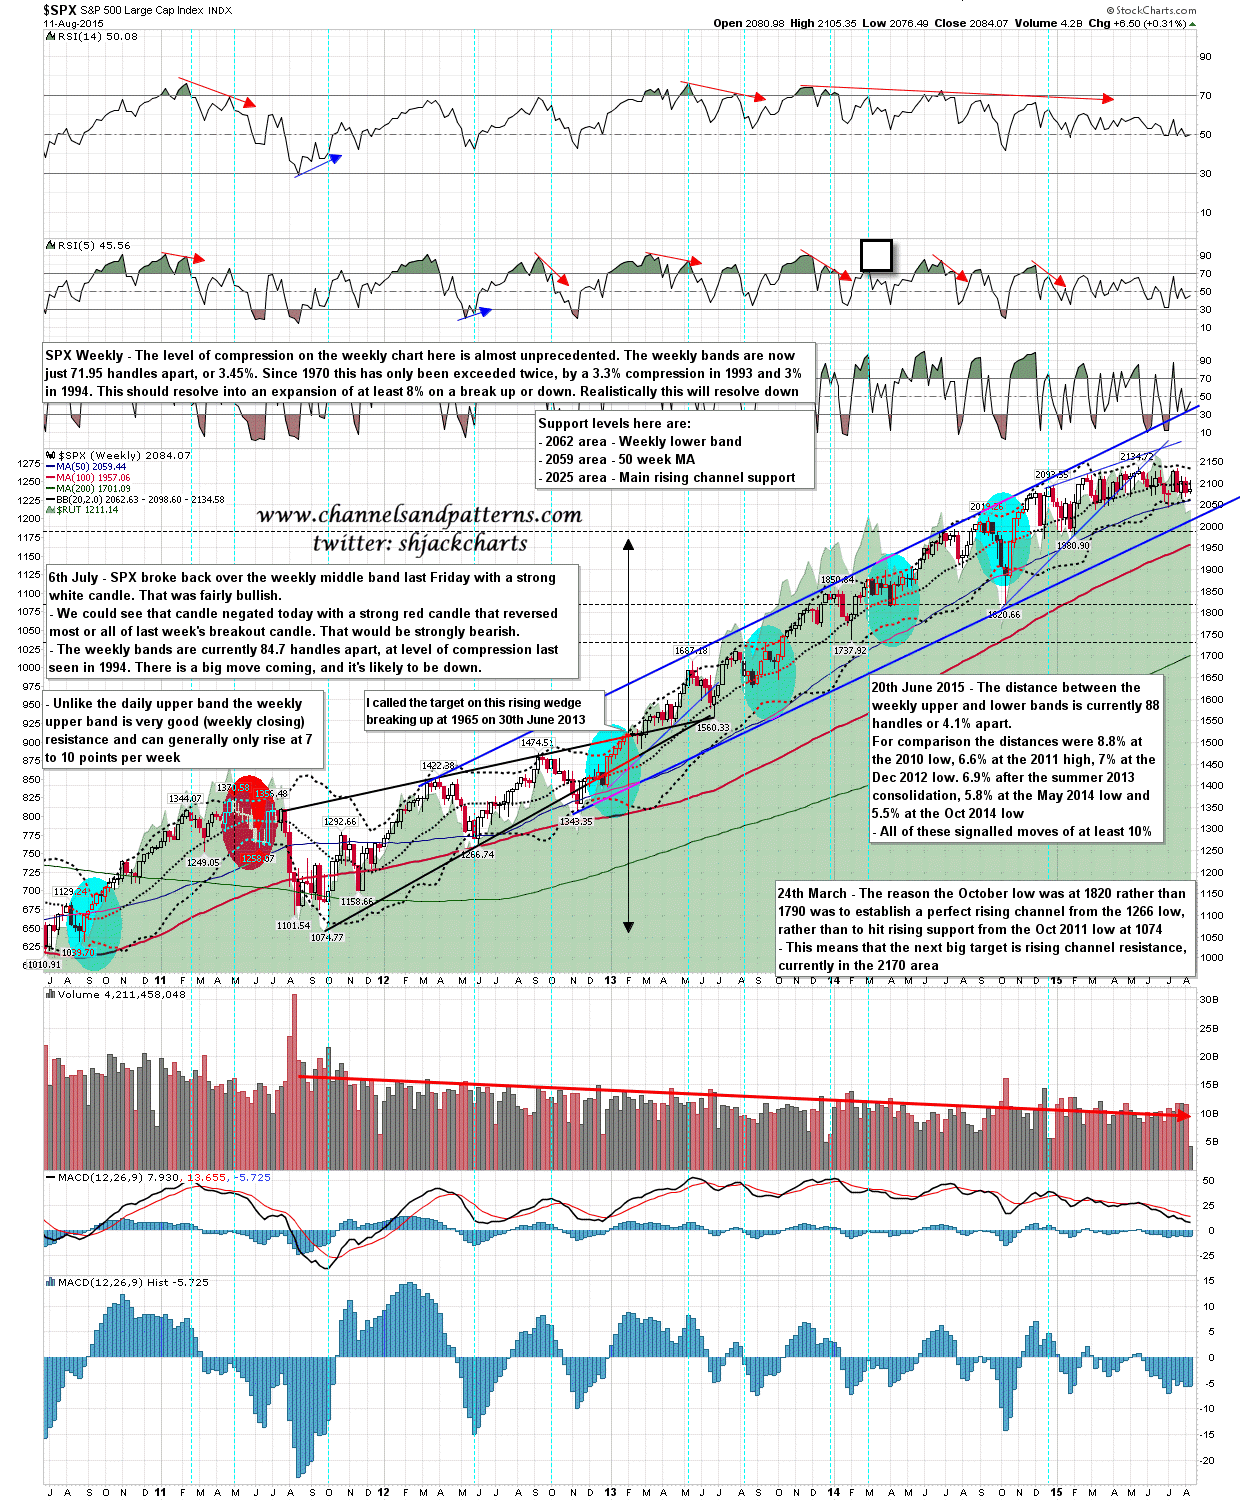
The important support levels here are mainly on the weekly chart, where the weekly bands are now just 3.45% apart, a level of compression only beaten marginally in 1993 and 1994 since 1970. This is very likely to resolve down, and the triangle break up that we are expecting first should just be putting the cherry on top of a very bearish technical cake.
The levels to watch here on the weekly chart are the weekly lower band in the 2062 area, the 50 week MA in the 2059 area, possible double top support at 2044, and if all that support can be broken then primary bull cyclical bull market rising channel support is now in the 2025 area. SPX weekly chart:
Stan is looking for 2040s here and I will be looking for a likely low there. I’ll also be watching the RSI triangles carefully and will call any closing break down there on twitter if seen. If this does break down below 2036 then the double top target would be in the 1950 area and I’d expect that to be made. Until that break of 2036 or RSI triangle break however, we are expecting the next decent move to be up.
