
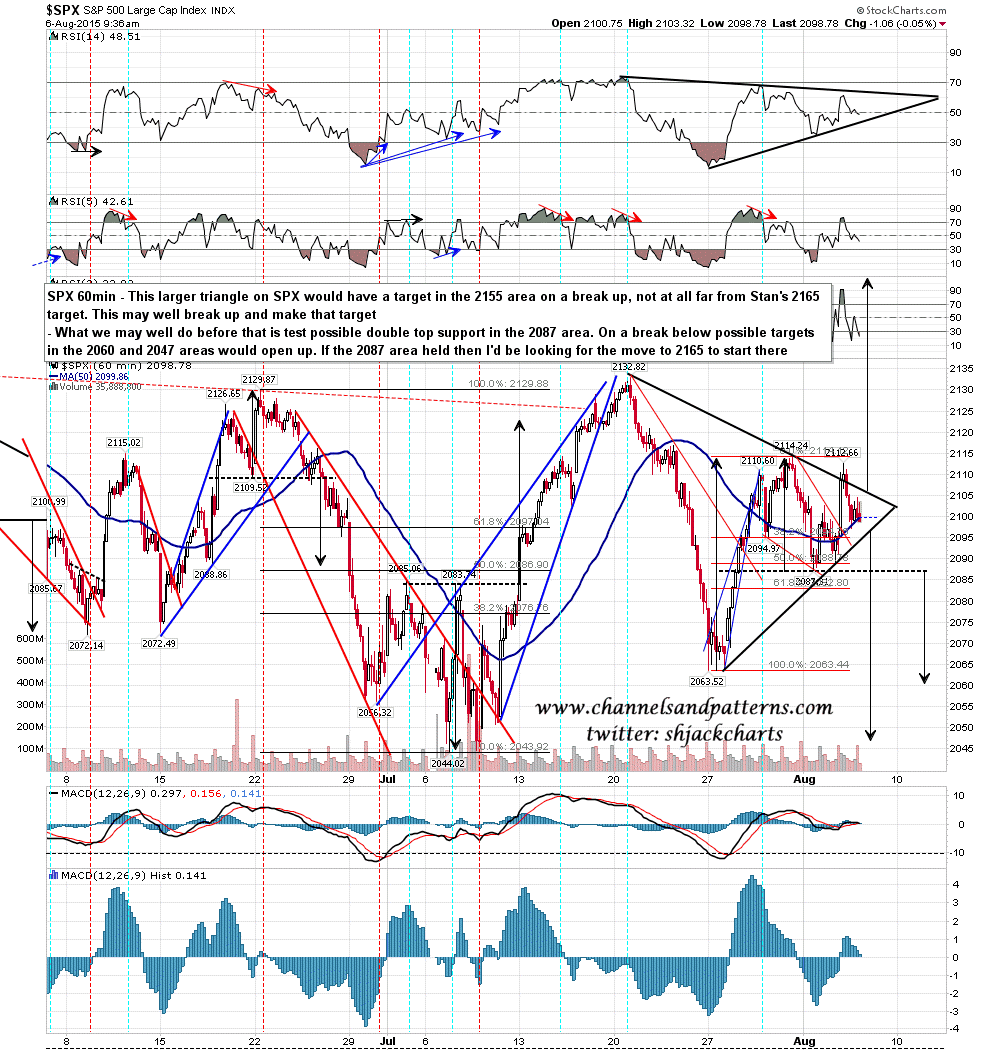
The small triangles I was looking at yesterday broke up and then retraced, so they are played out now. That has helped define the larger triangles that I mentioned which are shown below on SPX and Dow. I’m leaning towards a break up from these triangles towards Stan’s 2015 high target in the 2165 area, as long as SPX can hold the 2087 (current) floor area. SPX 60min chart:
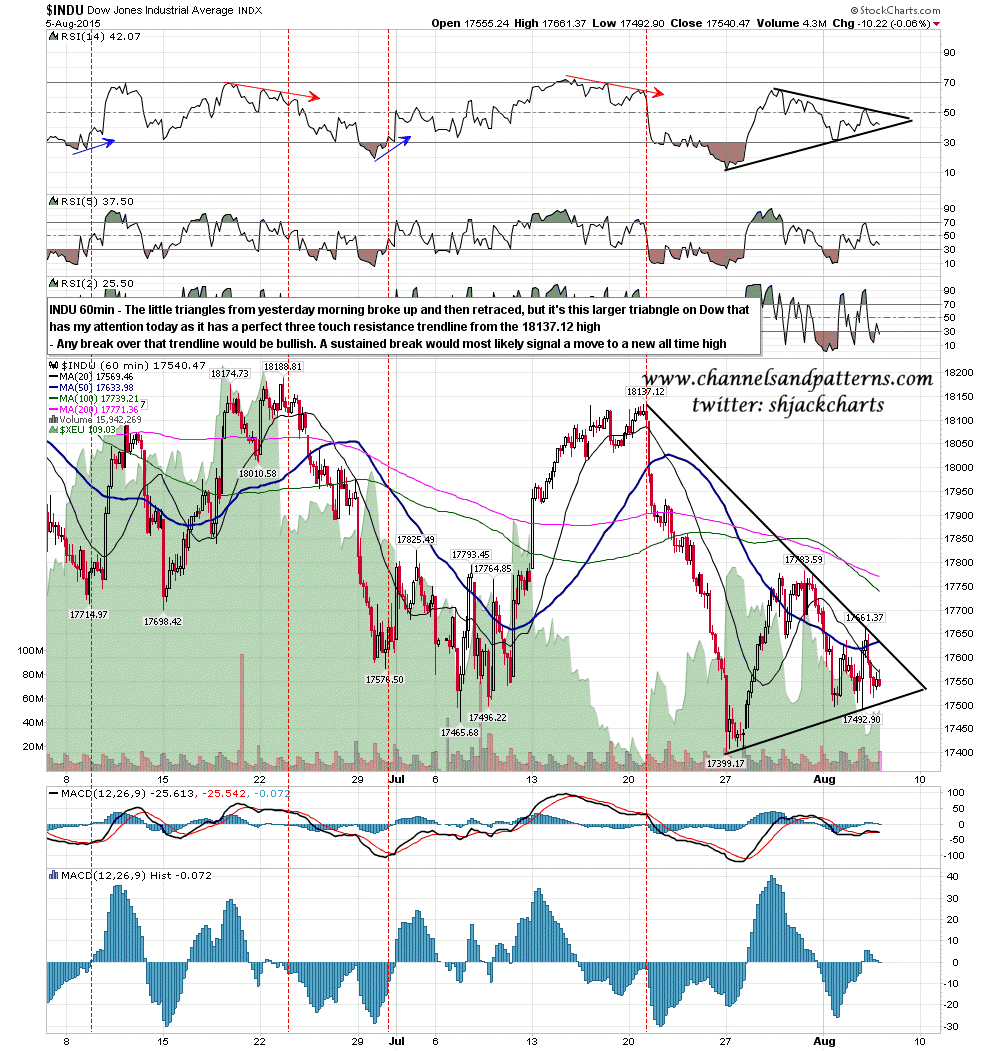
The Dow triangle is similar to the SPX version except that it has a very nice three touch resistance trendline from the July high at 18137.12. A sustained break above that would most likely signal the expected move to all time highs. INDU 60min chart:
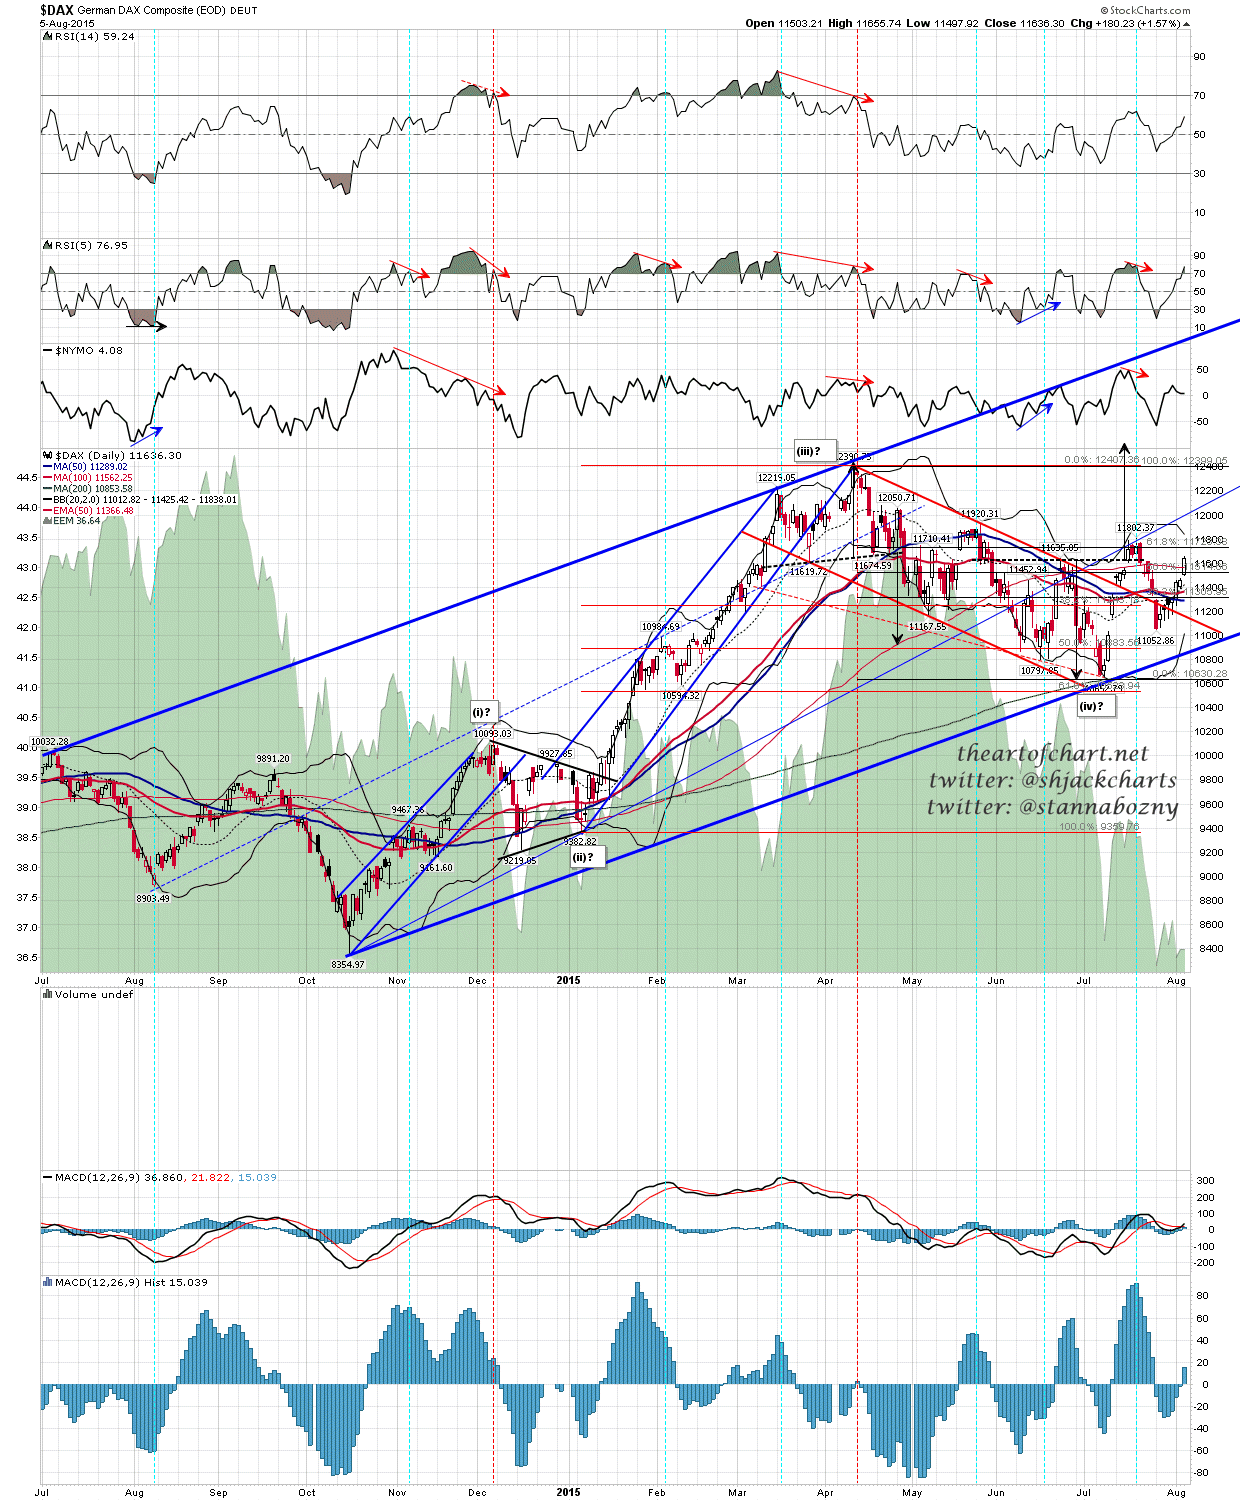
I’ve been taking a look at the DAX chart in the last few days and on the weekly chart the outlook is extremely bearish. On the daily chart though there is a setup that may well deliver a new all time high within a few days or weeks. That new high would most likely be the second high of a double top. Obviously this scenario would be a very decent fit with the 2165 new all time high then fail that Stan and I are looking for on SPX. DAX daily chart:
It’s all about 2087 SPX support today for me. If it holds today then we most likely start a leg up towards Stan’s 2165 target. If there is a sustained break below that 2187 support then that opens up lower pattern targets in the 2060 and 2045 areas. If the support holds we could see a V day with a strong afternoon rally.
