
That wasn’t a particularly satisfactory way to close the week on SPX, with a retracement still likely coming shortly but the action on Friday making a serious mess of the setups I was looking at in the morning.
The clearest charts here are Dow, TRAN and RUT. I’d generally exclude TRAN because it is often at odds with all other indices. Scan 3x 15min SPX INDU TRAN charts:
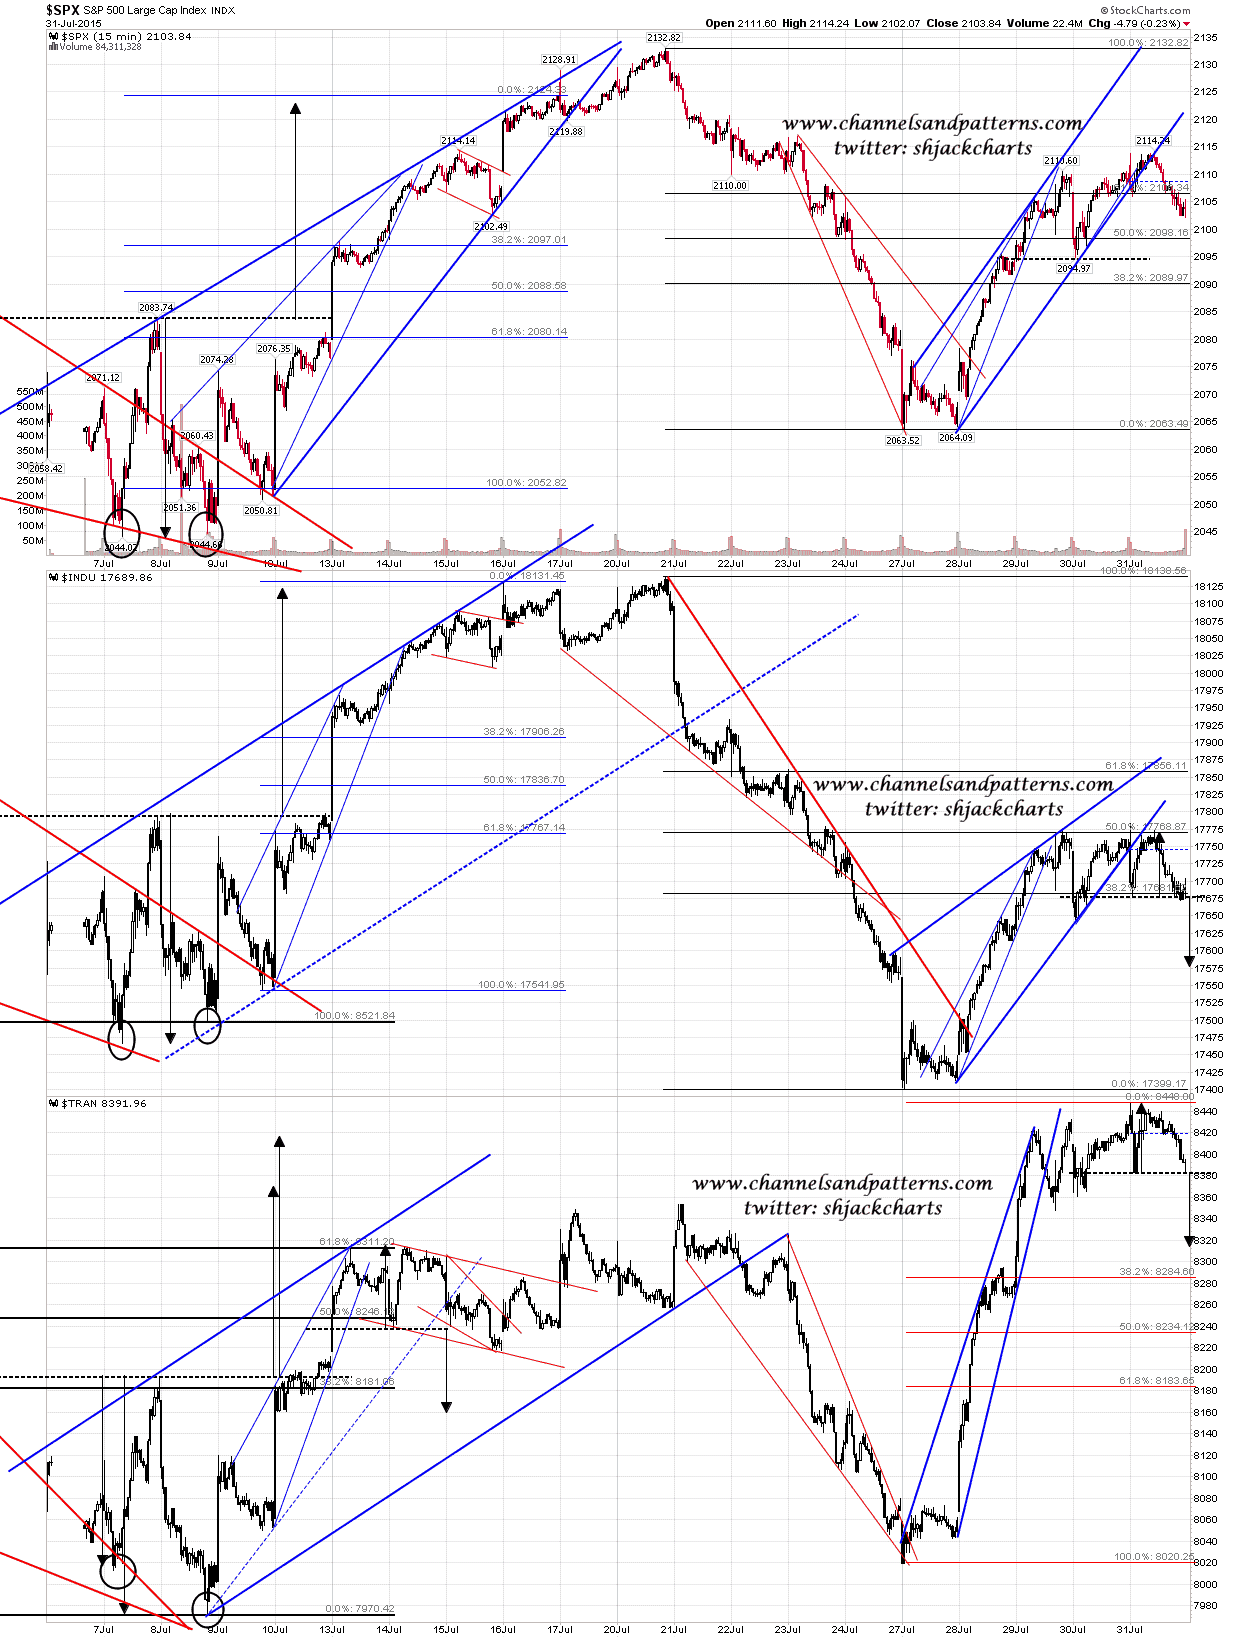
That leaves Dow and RUT and of those two only RUT is still in a very decent rising pattern from the last lows. It is therefore RUT I’ll be watching for the support break on that pattern. When we see that the retracement will most likely have already begun. Scan 3x 15min NDX RUT NYA charts:

I’ll add at the end the DAX chart that we were looking at yesterday in Chart Chat. This is a very nice rising channel from the 2009 that suggests strongly that DAX is currently forming the topping pattern to end the move up from that 2009 low. Food for thought. DAX weekly chart:

So what are the prospects for some retracement today? Well the stats on the first day of the month most definitely lean bullish, just as the stats for Friday leaned bearish. I’m therefore a bit doubtful about seeing that today. The rest of the first ten days of August lean bearish so tomorrow would be a better time to start. I also don’t have any sell signals on SPX here and would need to see Friday’s high tested or exceeded to generate a decent one. Significant retracements without RSI divergences leading to my sell signals tend to be rare, though they happen every so often. I’m keeping an open mind today.
Stan and I did our second Sunday Chart Chat yesterday covering indices, forex, bonds, precious metals etc. If you want to see that the video is posted here.
