I am late putting up a post tonight, because I attended an absolutely amazing lecture by Jaron Lanier on the Stanford campus. I’ve known about Jaron’s work since I first got into computers 35 years ago, but I had never heard him speak. He’s a straight-up genius. It was just an amazing talk that touched on politics, the economy, and data privacy.
Anyway. Let’s look at a handful of charts.
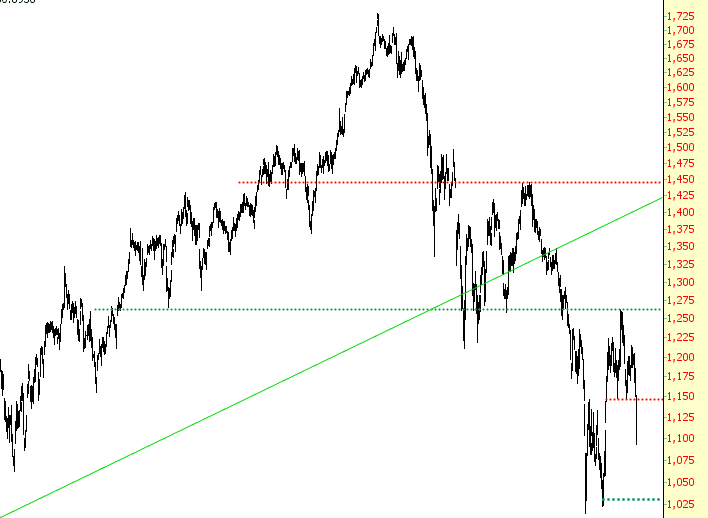
First is $XOI, the oil and gas sector, which has been my dearest friend all year. The miniature head and shoulders pattern has performed great, and the lowest green horizontal is my target.