Slope of Hope Blog Posts

Slope initially began as a blog, so this is where most of the website’s content resides. Here we have tens of thousands of posts dating back over a decade. These are listed in reverse chronological order. Click on any category icon below to see posts tagged with that particular subject, or click on a word in the category cloud on the right side of the screen for more specific choices.

Market Volatility Now In “Fragile Zone”

By -

Further to my post of December 3, 2015, the price of the SPX:VIX ratio has broken below a critical level of 100.00 and has fallen into, what I call, the Fragile Zone.

I named it this because, as you can see from the ratio chart below (where each candle represents 1/4 of a year), price has now encroached into the last major bearish candle of Q3 of 2011, and has also fallen below the 60% Fibonacci retracement level taken from the 2009 lows of this ratio to its highs of 2014.

A hold below 80.00 could see the SPX plunge, particularly if this ratio drops and holds below 60.00. The declining Momentum indicator is hinting that further weakness is ahead for the SPX…as I mentioned here, with respect to the E-mini Futures Indices.

Just A Little Further

By -

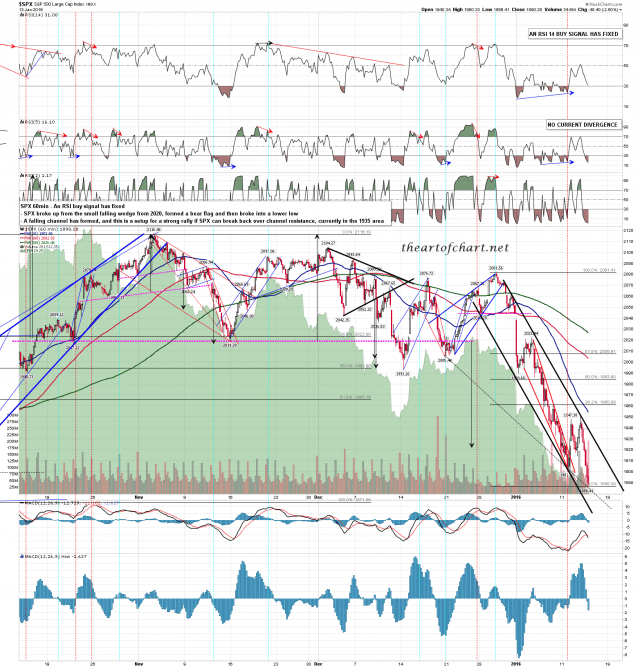
I was saying on my post yesterday that the bear flag setup strongly favored at least a retest of the lows and we most certainly got that. On a sustained break below the lows yesterday the full bear flag target is under 1800, but Stan and I are not expecting this break to be sustained. The other cycle trend day this week is tomorrow, and our lean is to see a strong rally then. Today or possibly tomorrow morning we should see a new low below yesterday’s low. Our ideal number is in the 1879 SPX area, which Stan has been looking at in our theartofchart.net subscriber daily video updates for the last few days. SPX might go a bit lower than that but a decent rally should be close now.

In the short term the falling wedge has now evolved into a falling channel and SPX is on a 60min buy signal that I’m expecting to see play out, most likely after marginal new lows are made. SPX 60min chart:

160113 SPX 60min

(more…)