
So, here we go, the year 2016 started with a bang, but a reverse one: the market imploded (actually it started to go down 2 days before the end of the year) and now we may be starting to see what many Slopers have desired for a long time: a BEAR MARKET.
Is it finally going to happen? Probably yes, it’s overdue. We think 2016 has really a high chance to see at least a 20% correction, but you know as it goes with predictions, everyone make one and then in the end they are all very unreliable as it is hard to actually predict anything in the stock market, aside from framing statistical behaviors (e.g. price patterns) that seem to happen repeated times in history and thus are somehow “predictable”. That is what we do at Retracement Levels.
Now, to get to the juice of this analysis, looking at the ESH16 DAILY chart below, aside from the arrows indicating the next RL LONG support in the ~1960 area, and next RL SHORT resistance in the ~2030 area, we can see something else, quite interesting:
1) lower tops since November (although nothing says we cannot have a higher top in February or March)
2) re-testing of the sub-2000 price area, an area that recently offered strong support and was always bought and sent the market back up to its upper limit (~2100)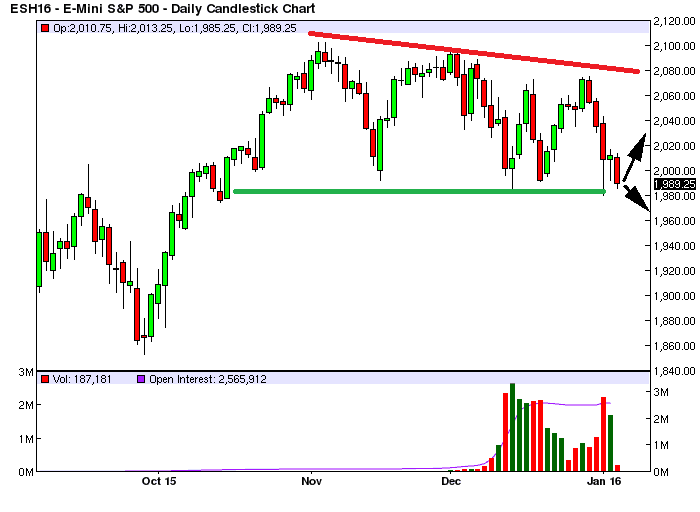
What is the conclusion? Well, on one side we can see declining rallies, which may actually indicate a Bear Market unfolding (note that we had said there was resistance in the ~2100 price area repeated times on SOH, in various previous posts published in 2015). At the same time there is a support line below 2000 that must be broken clearly, to let this “Bear Market” (or correction) unfold for real.
The model below hopefully can be of help to Slopers as it allows you to gauge where DAILY, WEEKLY and MONTHLY support is, to avoid going SHORT at the bottom, after the facts.

Click here if you want to gain 24/7 online access to the HOURLY/DAILY/WEEKLY/MONTHLY RL Odds Comparators through the SOH Offers, a specially-priced offer exclusively for SOH readers.
For example, long-term support (MONTHLY) begins at 1824.50 (yellow color area), so if you are a uber-Bear and want to hold your shorts, you can wait till then. The next stop is at 1671.25 (red color area). We think being able to hold shorts until this point would be a VERY lucky event for a Bear, we do not recommend it, most likely you will have to take profit much earlier. So now you know it: do not hope for a ride to ~600, it’s not going to happen!.
If you trade short-term we have HOURLY (intraday) and DAILY models, the DAILY is shown below, the market is VERY OVERSOLD at 1967.75 (red color area). Most likely a DAILY bounce will happen from there or before there, in fact 1984.50 is already OVERSOLD (yellow color area).
Medium-term (WEEKLY), shows that 1965.75 is a mildly OVERSOLD area (yellow color area). Again, a WEEKLY bounce may happen from here, although it is not granted, more like a 50-50 gamble (a bit better than that to be fair). This means that holding shorts beyond this point with a medium-term perspective, may be risky.
So overall our models give you a chance to ride market waves with a quantitative, statistical assessment of where trends may end, so you can get in or get out before the reversal happens.
Click here if you want to gain 24/7 online access to the HOURLY/DAILY/WEEKLY/MONTHLY RL Odds Comparators through the SOH Offers, a specially-priced offer exclusively for SOH readers.
