We just had the worst first week of a New Year in history.
China issues? North Korea nuclear tests? Or was it the Fed?
Assign whatever fundamental reason you want – the pattern was set up for this drop, according to Elliott Wave Theory, a form of technical anaylsis. I made this prediction shortly before it began in this Youtube video on December 27. I was off by a couple of days since the actual drop began on December 30.
I also posted this on my iTunes podcast.
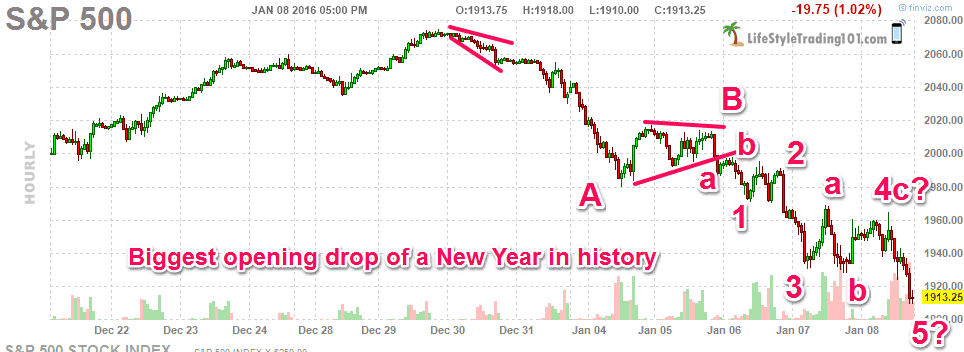
My prediction for Friday was off – I thought we completed the 5-wave pattern, but in fact the yellow 5 – is really a b-wave low.
Instead, this is what happened:
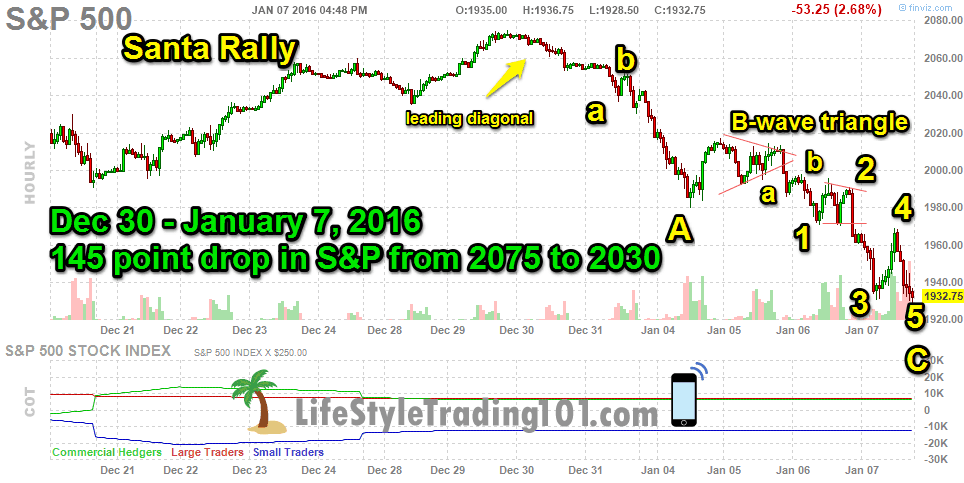
While my prediction wasn’t perfect on Friday — it was quite accurate for every turn from December 8 til Janurary 7.
We were at 2075 – and we experienced a 5-wave leading diagonal.
The consolidation between December 30-31 without a bounce was a key clue that the bullish possibility would now be off the table. And instead, we would begin a change in direction.
We get the beginnings of an a-b-1-2 pattern – with possibility of a 3rd wave next
Sunday/Monday, January 4:
We got the 3rd wave — confirming the down trade, but then experienced a big bounce that night in what would be a B-wave triangle
We got the b-wave triangle that just went up and down all day and ended near the higher ends of ES2013
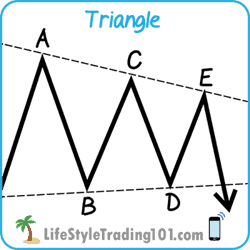
That night, we broke out of that triangle and began what might be the c-wave drop — which should follow the pattern a-b-1-2-3-4-5.
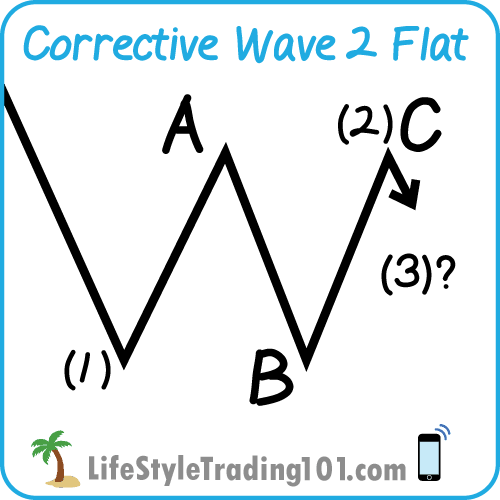
Indeed, we got an A-B-C flat for wave 2

This pattern suggests a 3rd wave down next.
We got the 3rd wave down over night – but also a huge rally during the day – that followed a drop into the close.
This is where my mistake was – I mistook that drop as a 5th wave – but really it was a b-wave.
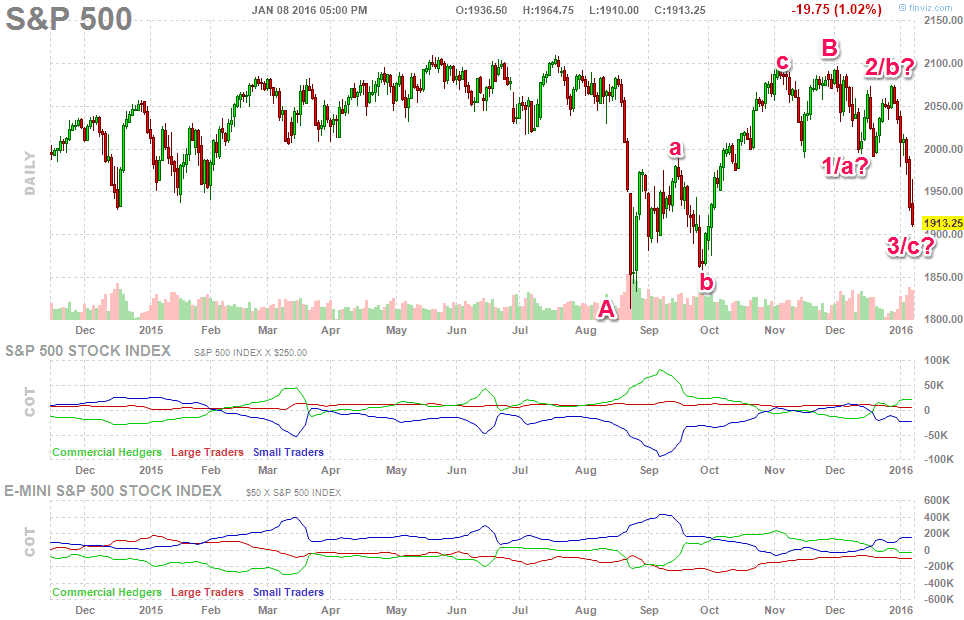
We finished the A-B-C 4th wave flat – and then got a 5th wave down.
Where to from now?
At this point, we are left with the question of whether that 5th wave is complete or whether this is a potential extension. It looks like we may potentially retest the August 2015 lows – which I expect sometime in the next few months – but in terms of timing – I do not know exactly when.
it looks like there could be some more downside left. Ideally, I would like to see the 1950-1980 region to be tested to give another opportunity to re-enter shorts. I think we should get some important clues in the coming days as to whether we are going to 1850 right away or taking a bounce up first before coming down to those levels and potentially lower later in the year.
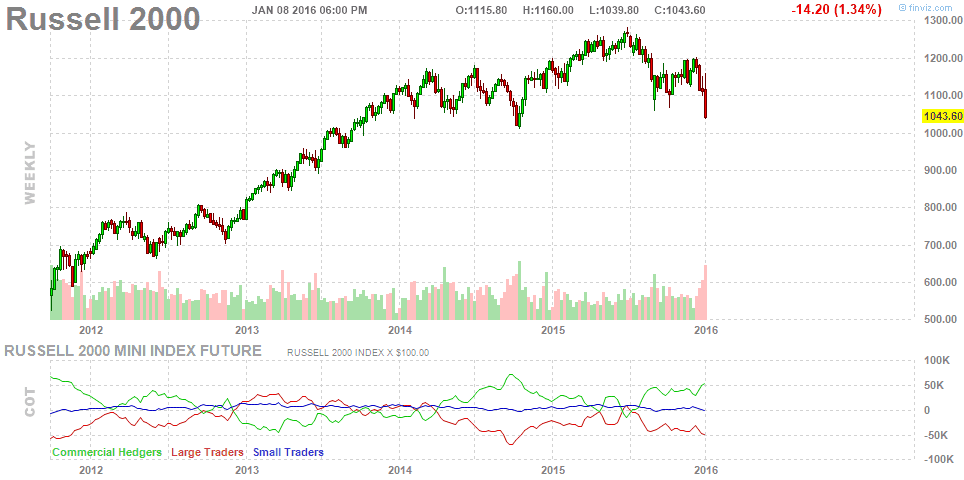
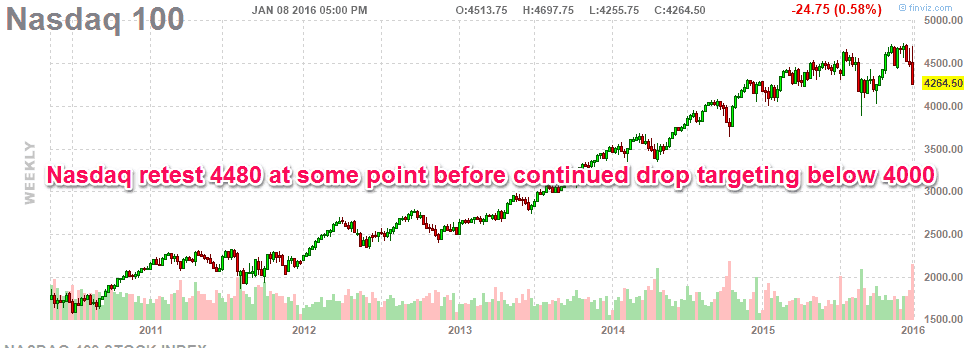
Some other important charts to take note of: