What a mess! A drop and hold below 100 will signal that a big downdraft is in store for equities, as shown on the following Monthly SPX:VIX ratio chart.
Further background information can be found at this last post on the ratio.

Slope initially began as a blog, so this is where most of the website’s content resides. Here we have tens of thousands of posts dating back over a decade. These are listed in reverse chronological order. Click on any category icon below to see posts tagged with that particular subject, or click on a word in the category cloud on the right side of the screen for more specific choices.
What a mess! A drop and hold below 100 will signal that a big downdraft is in store for equities, as shown on the following Monthly SPX:VIX ratio chart.
Further background information can be found at this last post on the ratio.
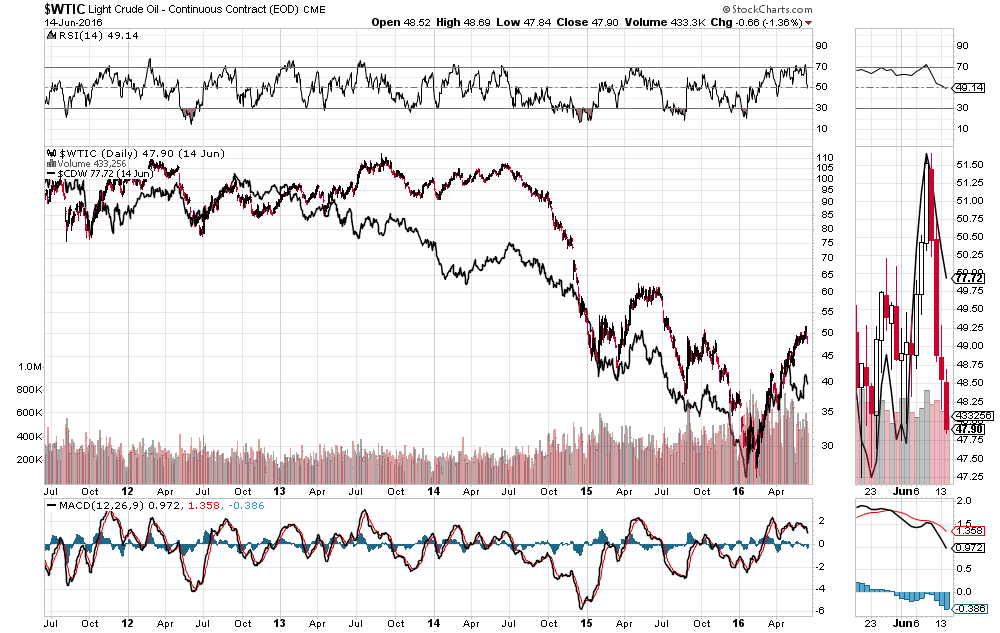
If WTIC Crude Oil breaks below it’s current (very tight) uptrend line, watch for the Canadian Loonie to tank.
As shown on the following 5-Year Daily chart comparing the two, they normally trade lock-step. Note the recent divergence of the Loonie starting in April and the fact that the RSI and MACD have fallen below the 50 level…which are hinting of further weakness ahead for Oil.
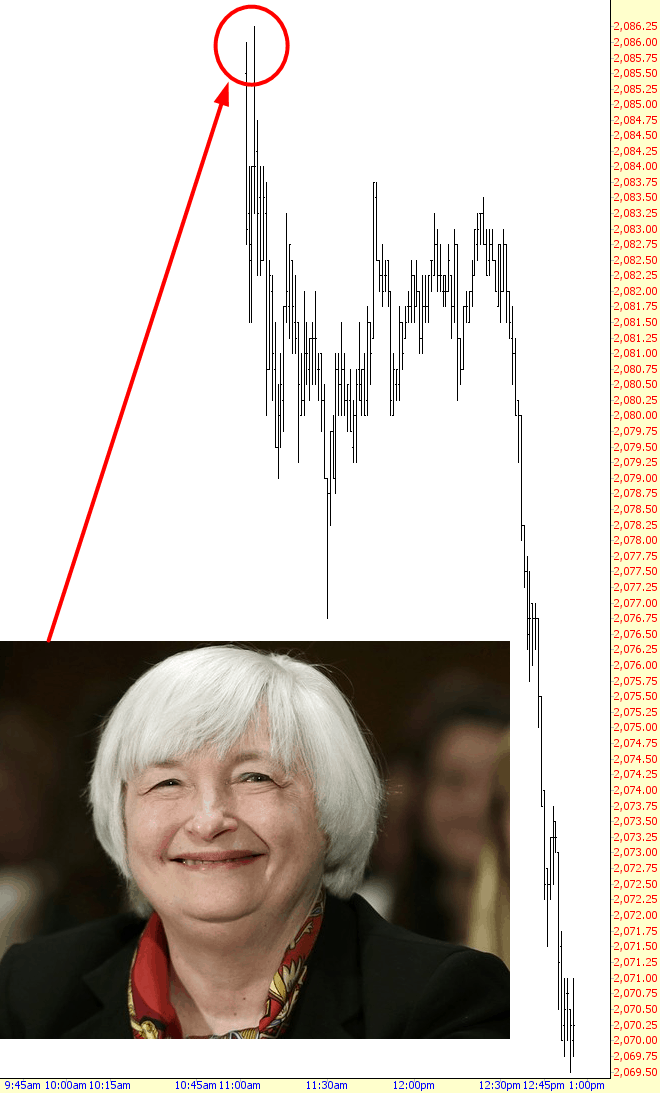
Well, since we’re all just sitting around waiting for Yellen, I was thumbing through charts and saw something that’s just plain weird. It’s totally non-actionable; it’s simply interesting to me. Here’s the chart:
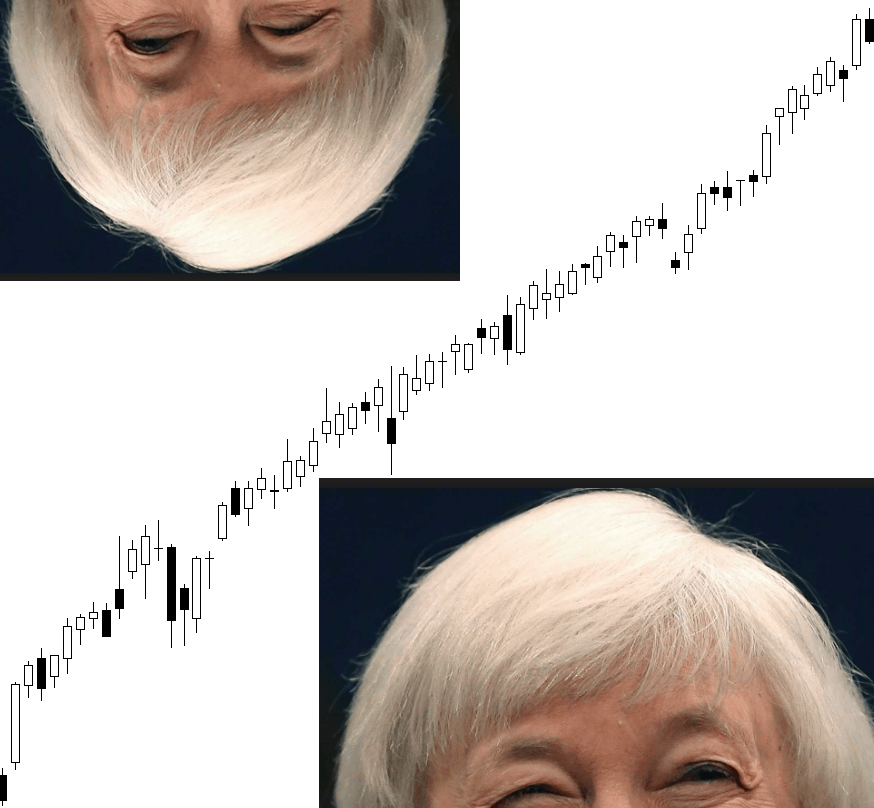
Steady, isn’t it? I think there are passbook savings accounts with more volatility.
Want to know the stock? Chipotle! Yes, that Chipotle. For months and months – – years, actually – – the stock just pretty much went up every day a little bit. I have looked at millions of charts (literally) over the years, and this is just freakish.
Of course, those days are long past, since CMG has lost 50% (yes, 50%) of its value, since their e-coli surprise was a turn-off for some diners. Anyway – meh – just thought I’d share.
