
If currency markets continue to experience high volatility with a strengthening US dollar, I think equity markets, including North American markets, will follow suit.
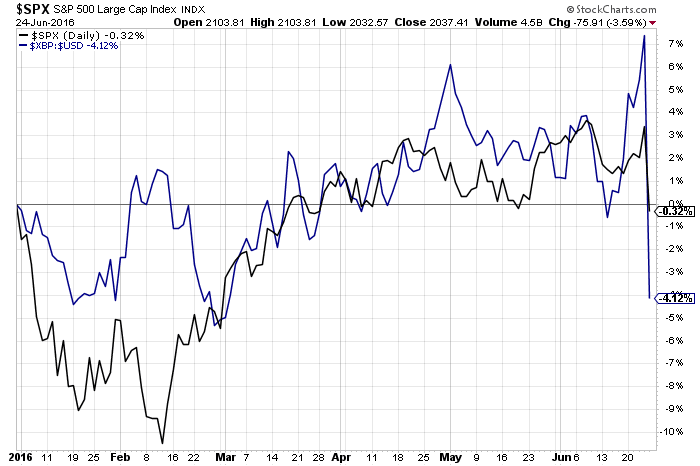
So, I’ll keep a close eye on those as potential canaries in the coal mine; e.g., to see whether the spread continues to widen (downward) between the SPX and the Pound:USD Forex pair, as shown on the Year-to-Date comparison chart below (the Pound lost 8.75% last Thursday and Friday).
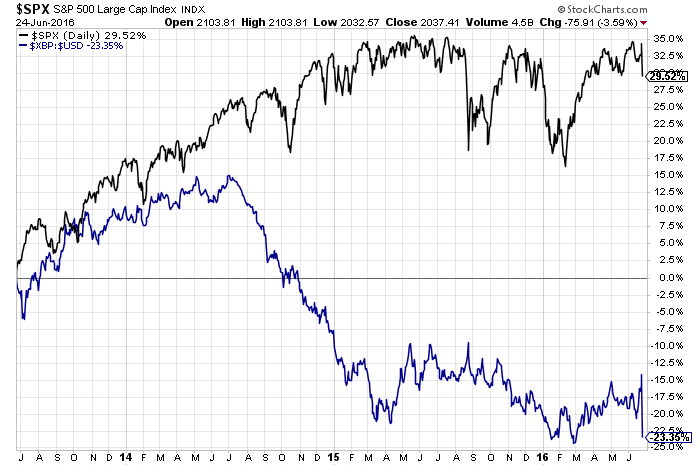
Also, note the great disconnect, starting in mid-2014, on the 3-Year comparison chart below. I think currency markets were beginning to price in and forecast major world equity market volatility (that will, ultimately, be larger and last longer than most people currently anticipate).
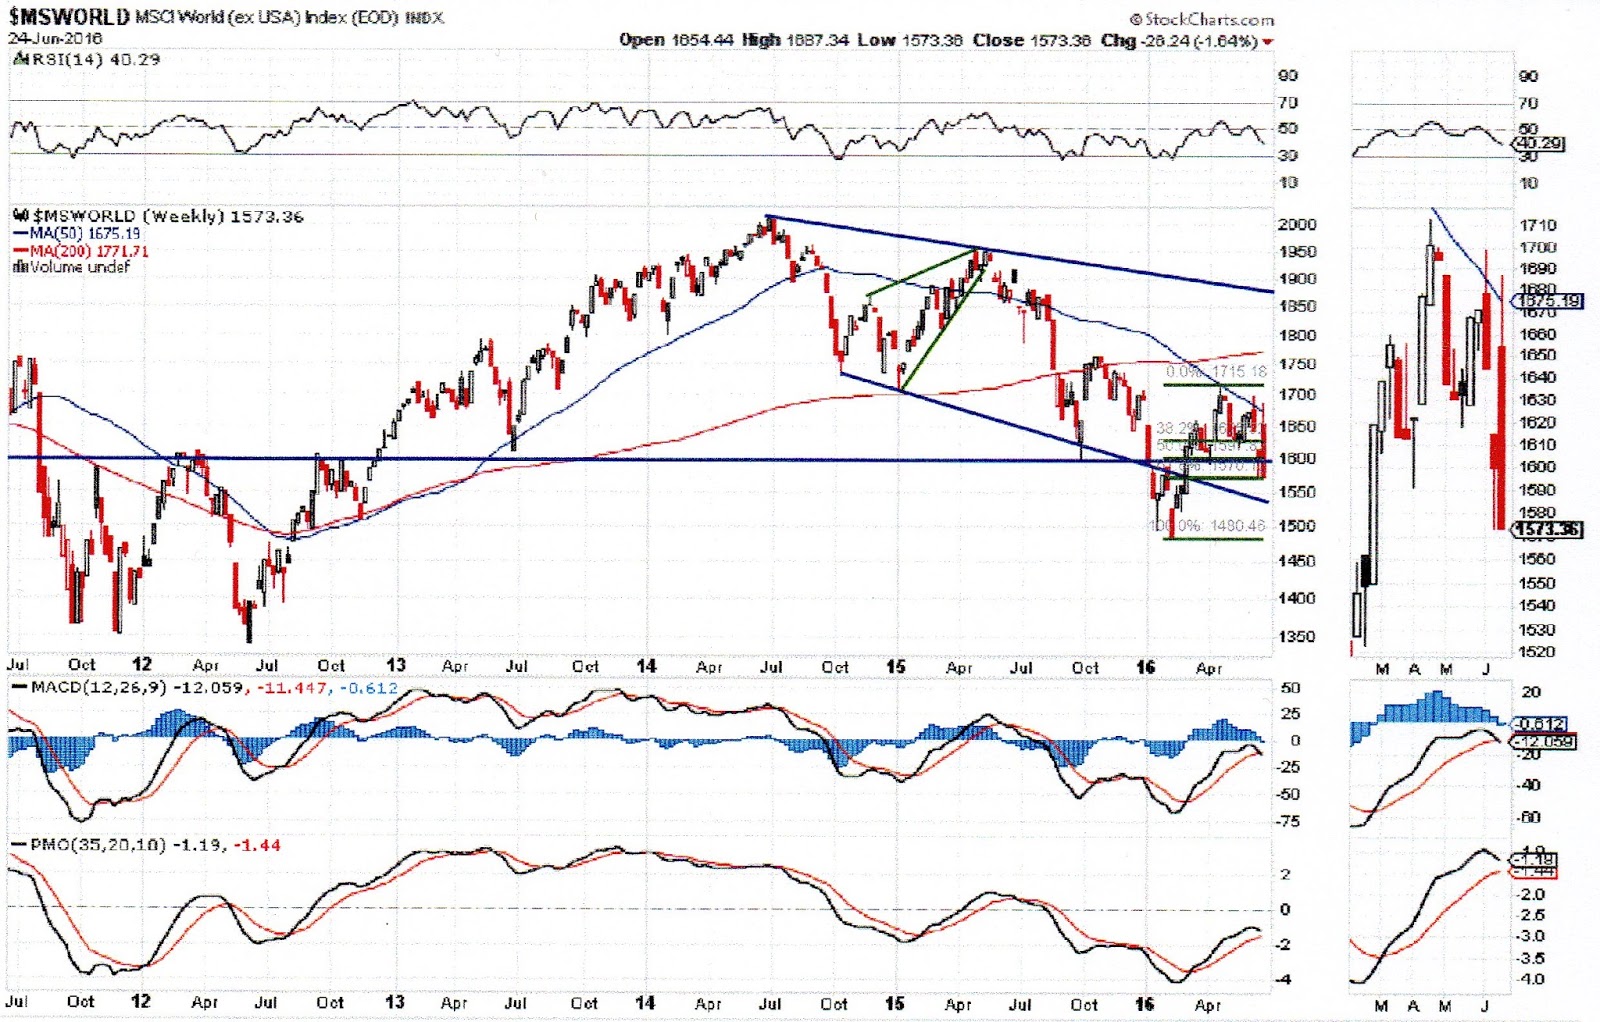
Further to my last post on the World Market Index, price did, indeed, rally above major resistance of 1600 and appears to be forming an inverse Head & Shoulders pattern on the Weekly chart, below. However, a potential neckline is downward-sloping and price has fallen below 1600, once again, to the 60% Fibonacci retracement level. As well, new “SELL” signals are triggering (or are about to trigger) on all three indicators on this timeframe.
If price fails at current levels, I’d be wary of North American equities succeeding with any kind of sustainable rally, as it could very well be a short-term dead cat bounce. The currency canaries may provide confirmation of this potential event…worth monitoring.
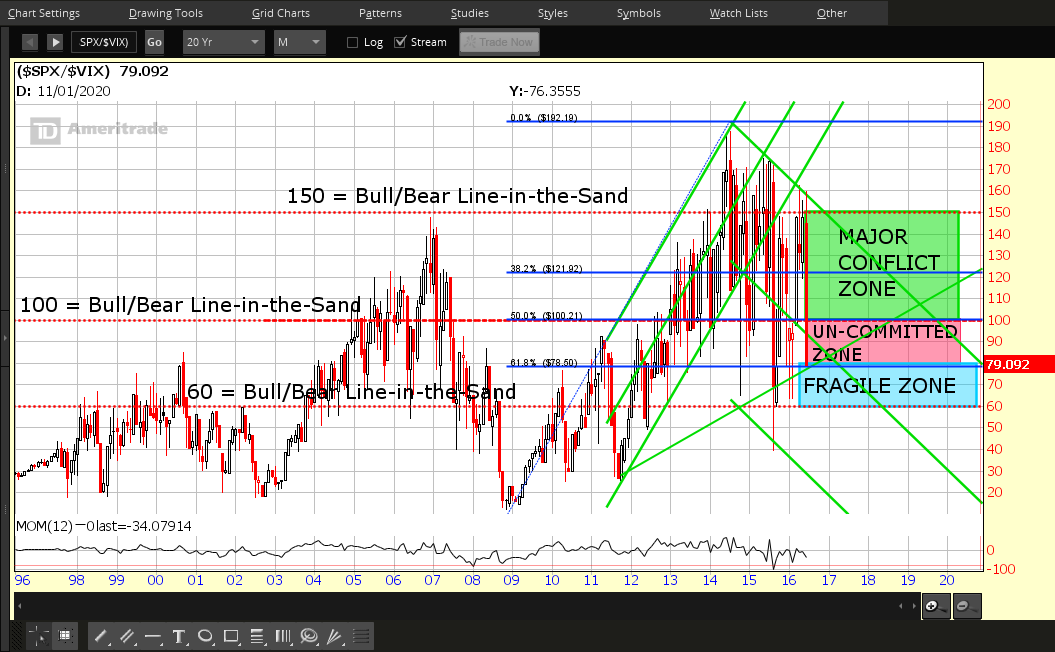
Once again, price has plunged into the “Fragile Zone” (below 80) on the SPX:VIX Monthly ratio chart below.
As I mentioned here, a drop and hold below the 100 Bull/Bear Line-in-the-Sand level would signal that a downdraft is in store for equities. We saw the beginnings of that scenario play out on Friday, as the SPX lost 3.59%, following results of the UK Brexit vote.
We’ll continue to see high levels of equity volatility as long as price on this chart remains below 100, and, to a lesser degree, below 150 (the next Bull/Bear Line-in-the-Sand level).
In conclusion, I’d re-iterate what I said in my March 3rd UPDATE to my post of February 17th…
“We’ll see if the newly penetrated 100 level holds as support now on the SPX:VIX ratio, as well as the 1600 level on the World Market Index, as shown on the following updated Daily charts of both. If so, it looks as though equity markets are in for a new bull run…possibly to new highs sometime this year. Otherwise, another failure of both of these levels will likely begin a new bear run to new lows.”
The last sentence is the most important one to note.
