
It was a volatile OpEx week for sure. The majority of the downdraft this week was contained to Monday and Tuesday with Wed-Fri being mostly chop. I’ll start with the daily S&P 500 chart (screencap from stockcharts.com)
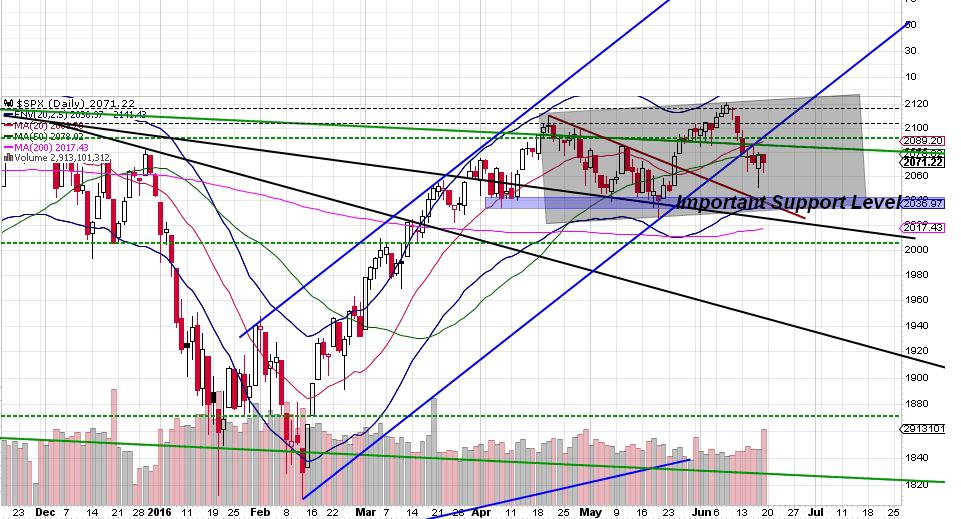
The daily SPX lost the support of its uptrend channel promptly Tuesday morning. This support line should show significant resistance when tested so it is likely that if price rallies too soon, it will only hit a ceiling and retreat again which could just result in a lot of chop. SPX has basically established a trading range between 2036 and 2110. Support at 2036 is fairly important here and should be a good divider for the bull and bear arguments in the near future.
Obviously, if 2036 gives out, we should be expecting a measured move down in approximately the depth of the range. At 74 points, that would call for a 1962 target. I’ll zoom in to the hourly now and share what I see there.
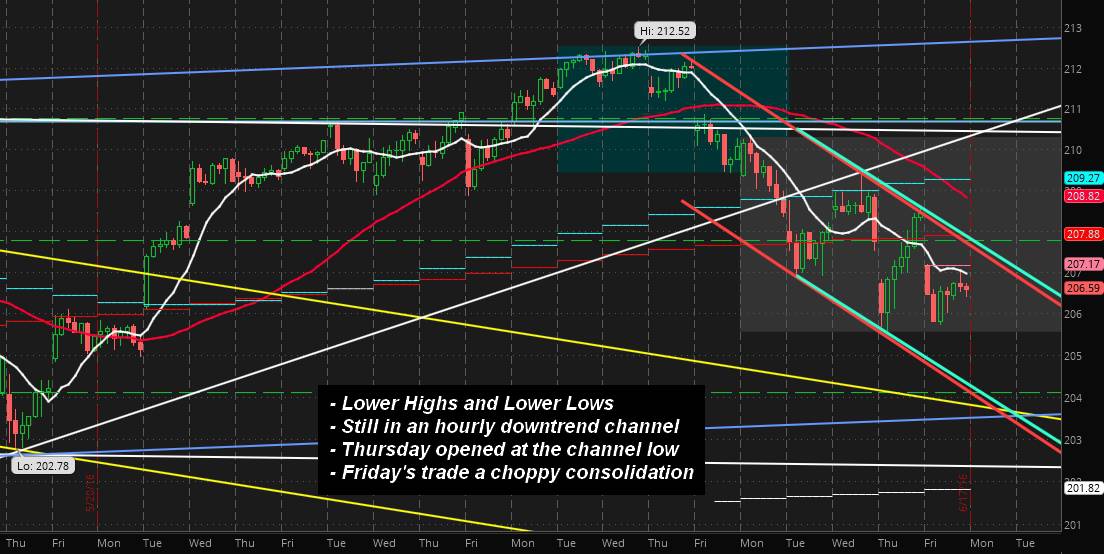
The hourly SPY trend is still obviously down and would have to rally to $209 just to stall the downtrend. A breakout above $209 could reverse the trend back up.
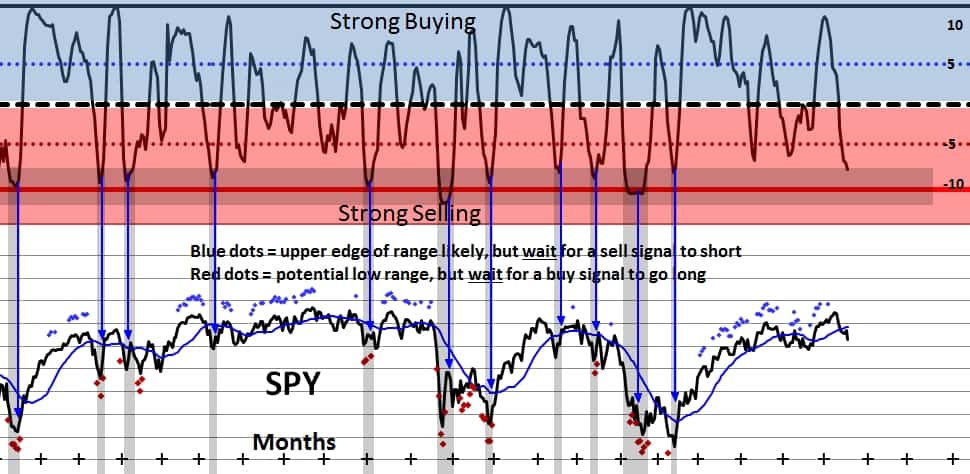
Looking at my personal breadth indicator being at its lows, I have highlighted other time periods when the indicator was this low. I hate to disappoint the bears, but more often than not it indicated a rally was imminent except in cases when a truly strong downtrend was in force. From these indicator levels, however, there was often also room for a little more selling before finding a bottom. Judging from the condition of the daily and hourly charts, I am expecting another test of 2036 that holds.
The “top of range” signal has also disappeared (blue dots above SPY price) which indicates that volatility expectations have been reset. This indicates that there is now room for higher highs than what we’ve seen so far if price should get back up there.
I’m leaning short for the start of trade Monday morning and am looking for a “scare” event (which Brexit may provide) before initiating a rally of unknown length.
Good luck out there.
