
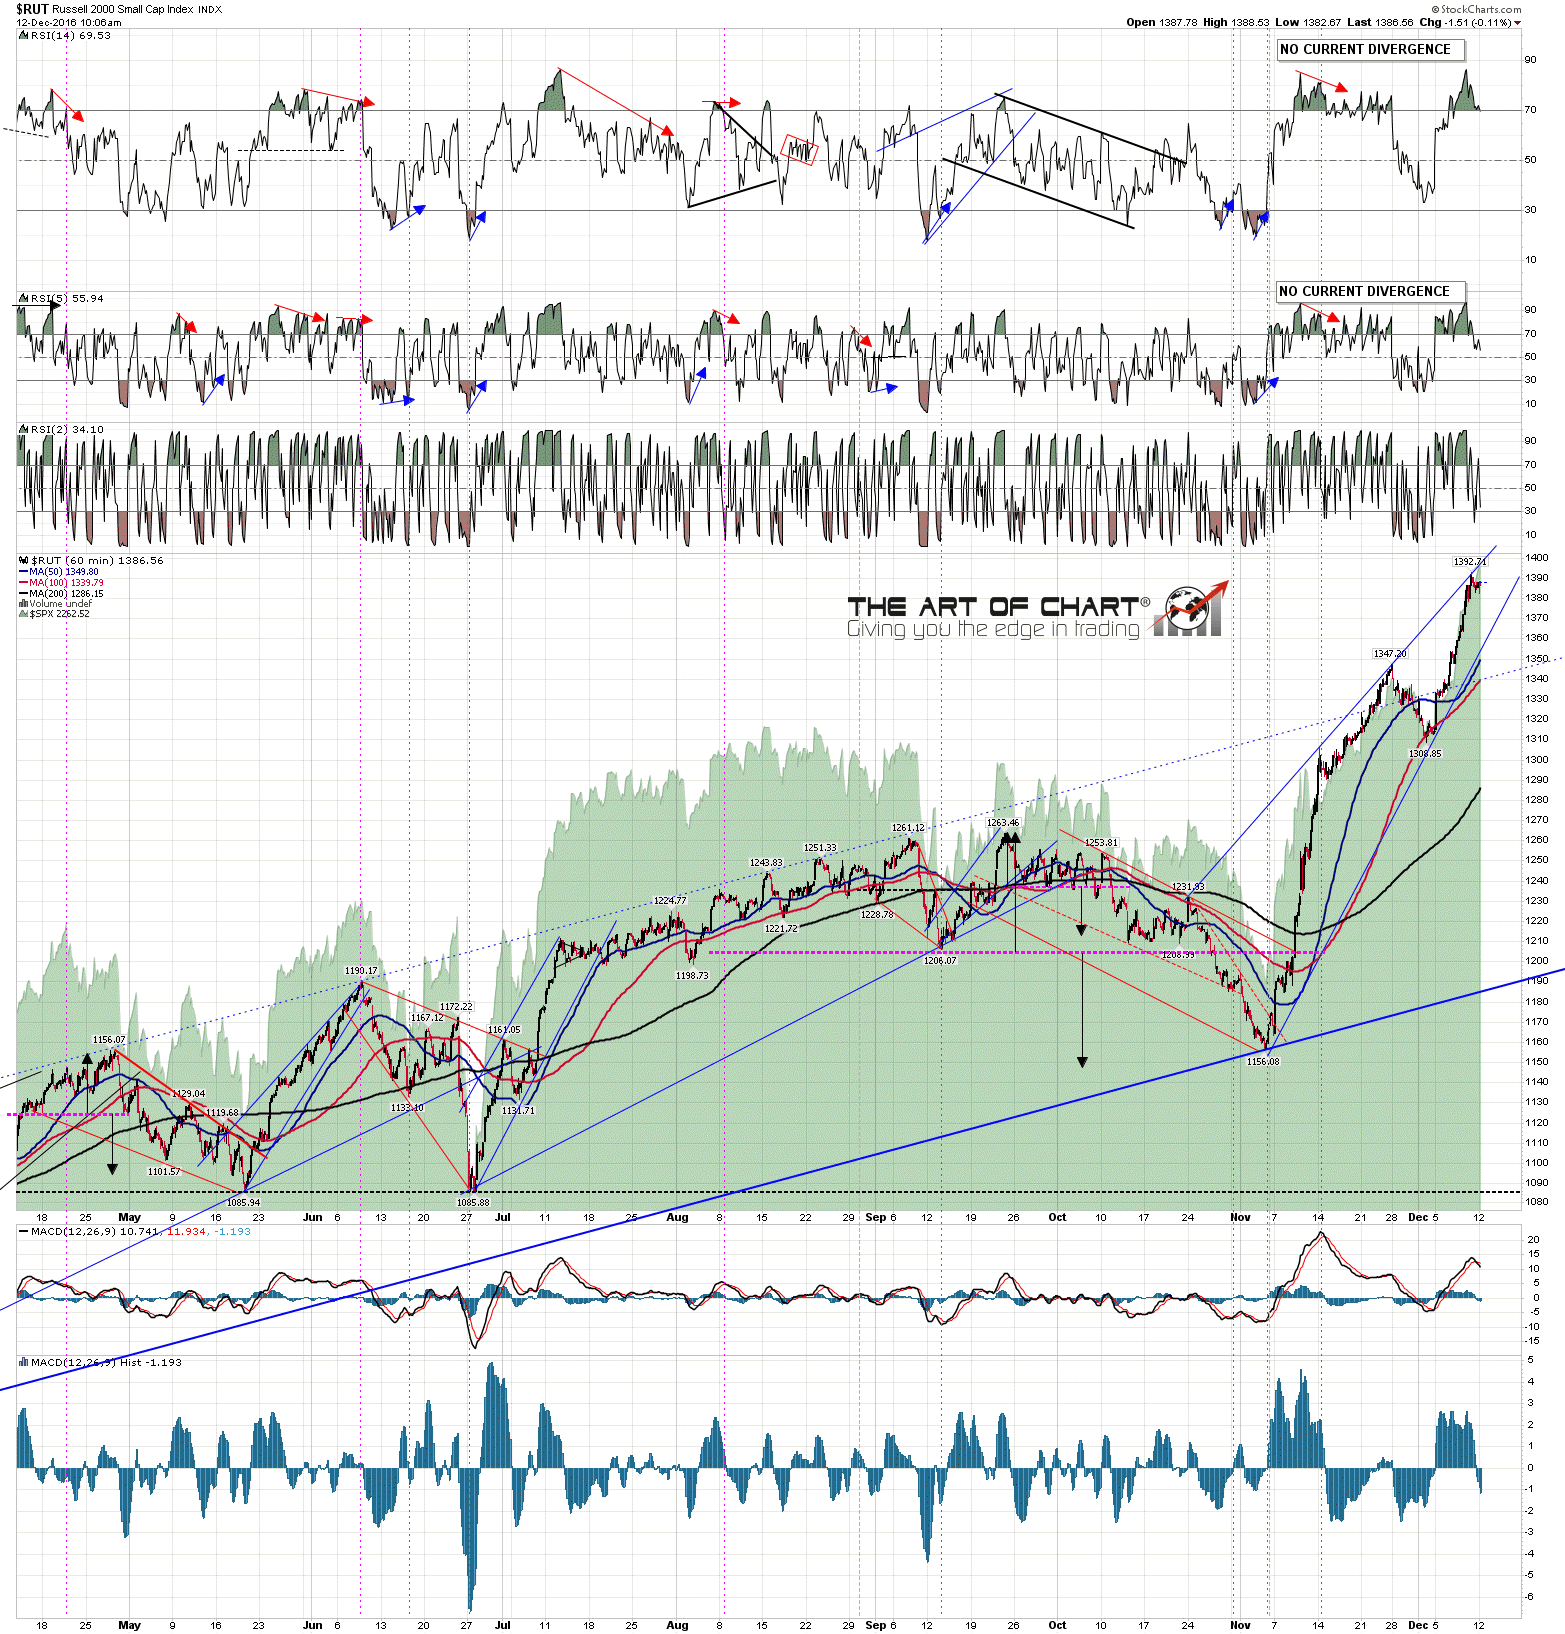
I posted the RUT 60min chart on Friday morning showing RUT testing a decent looking rising wedge resistance trendline and obviously expecting that to hold. If you were just watching SPX and NDX over the rest of the day you might well have assumed that the RUT wedge resistance was demolished by the bulls, but actually it held, and anyone shorting RUT from the Friday morning high had a pleasant if unexciting day.
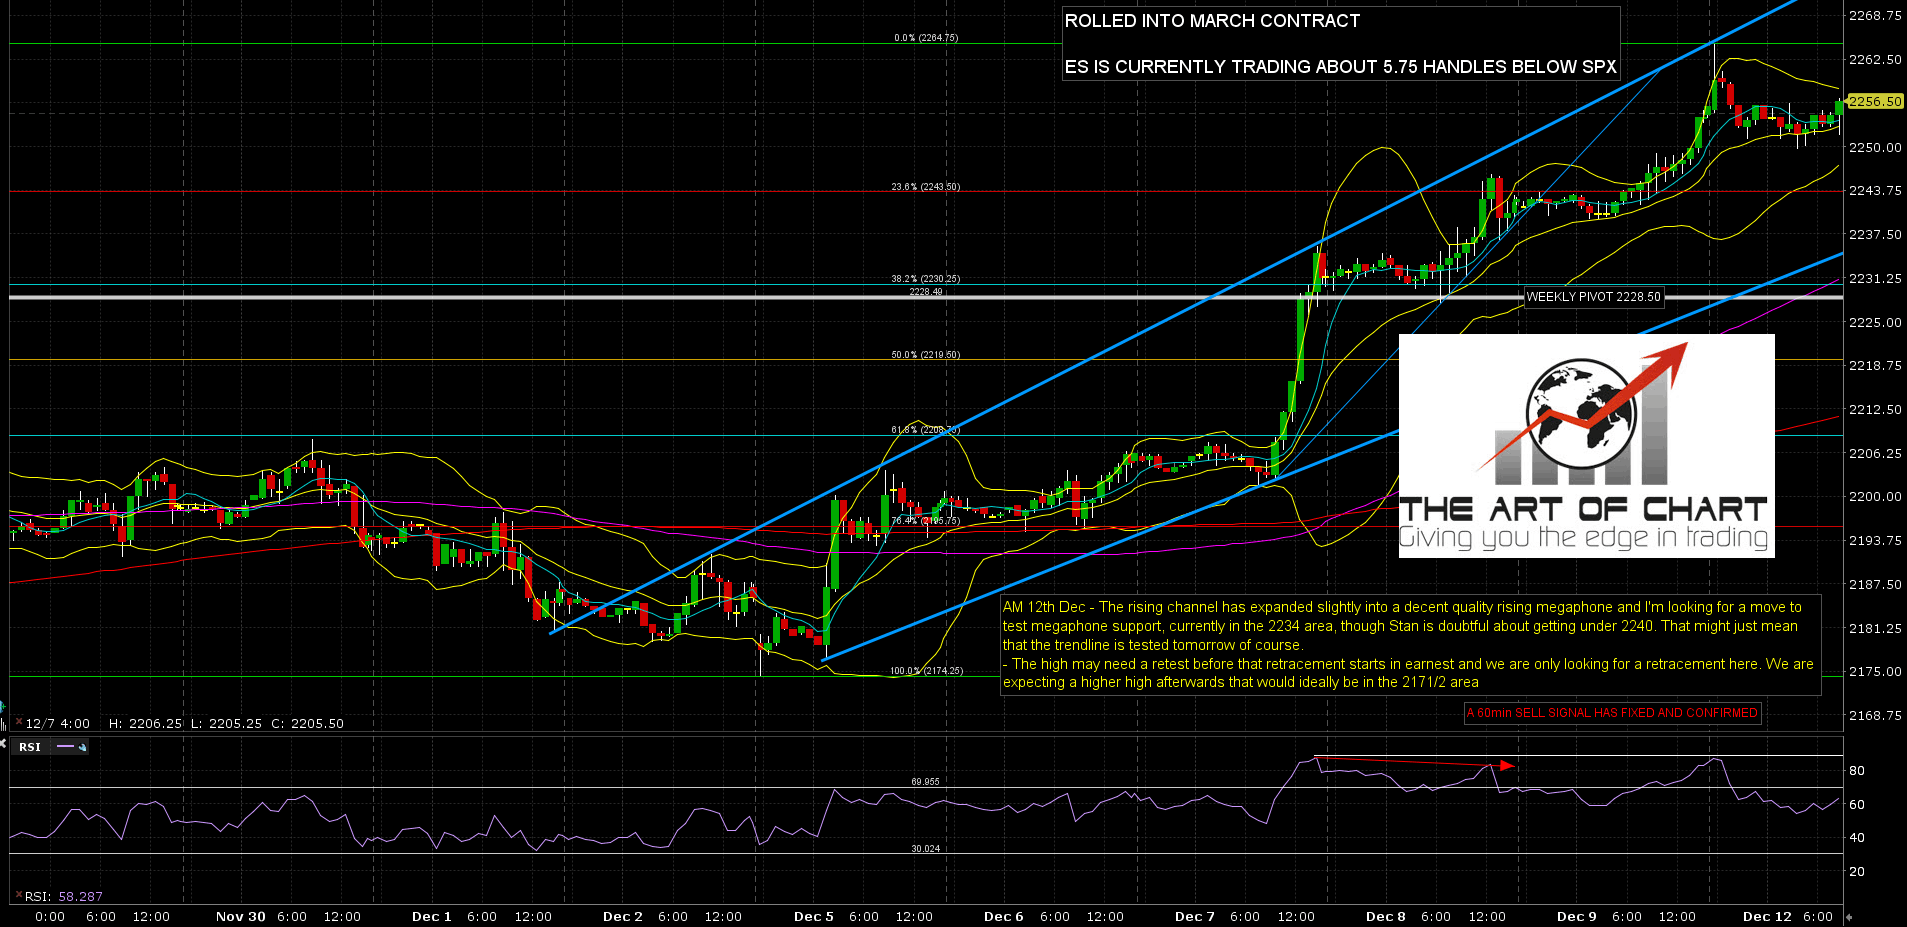
What does this mean? Well firstly it’s a reinforcement of something I mention regularly, in that correlations are hit and miss for trading purposes. If I think USD is headed higher I won’t short GC, as the inverse correlation might fail even if I’m right about USD. I would always go long USD & cut out the middleman. That’s why I didn’t short ES on Friday because TF was hitting serious resistance, I shorted TF & had a pleasant day.
Secondly it means that this has all likely been short term topping action for the retrace that I’m looking for, and I think that’s starting now, though these highs might still need a retest before the main retrace begins.
That said my expectations are modest. The retracement should only take a day or two and should be followed by a higher high, with an ideal target in the SPX 2277 area to make a high that should last a few months. We’ll see how that goes.
RUT 60min chart:
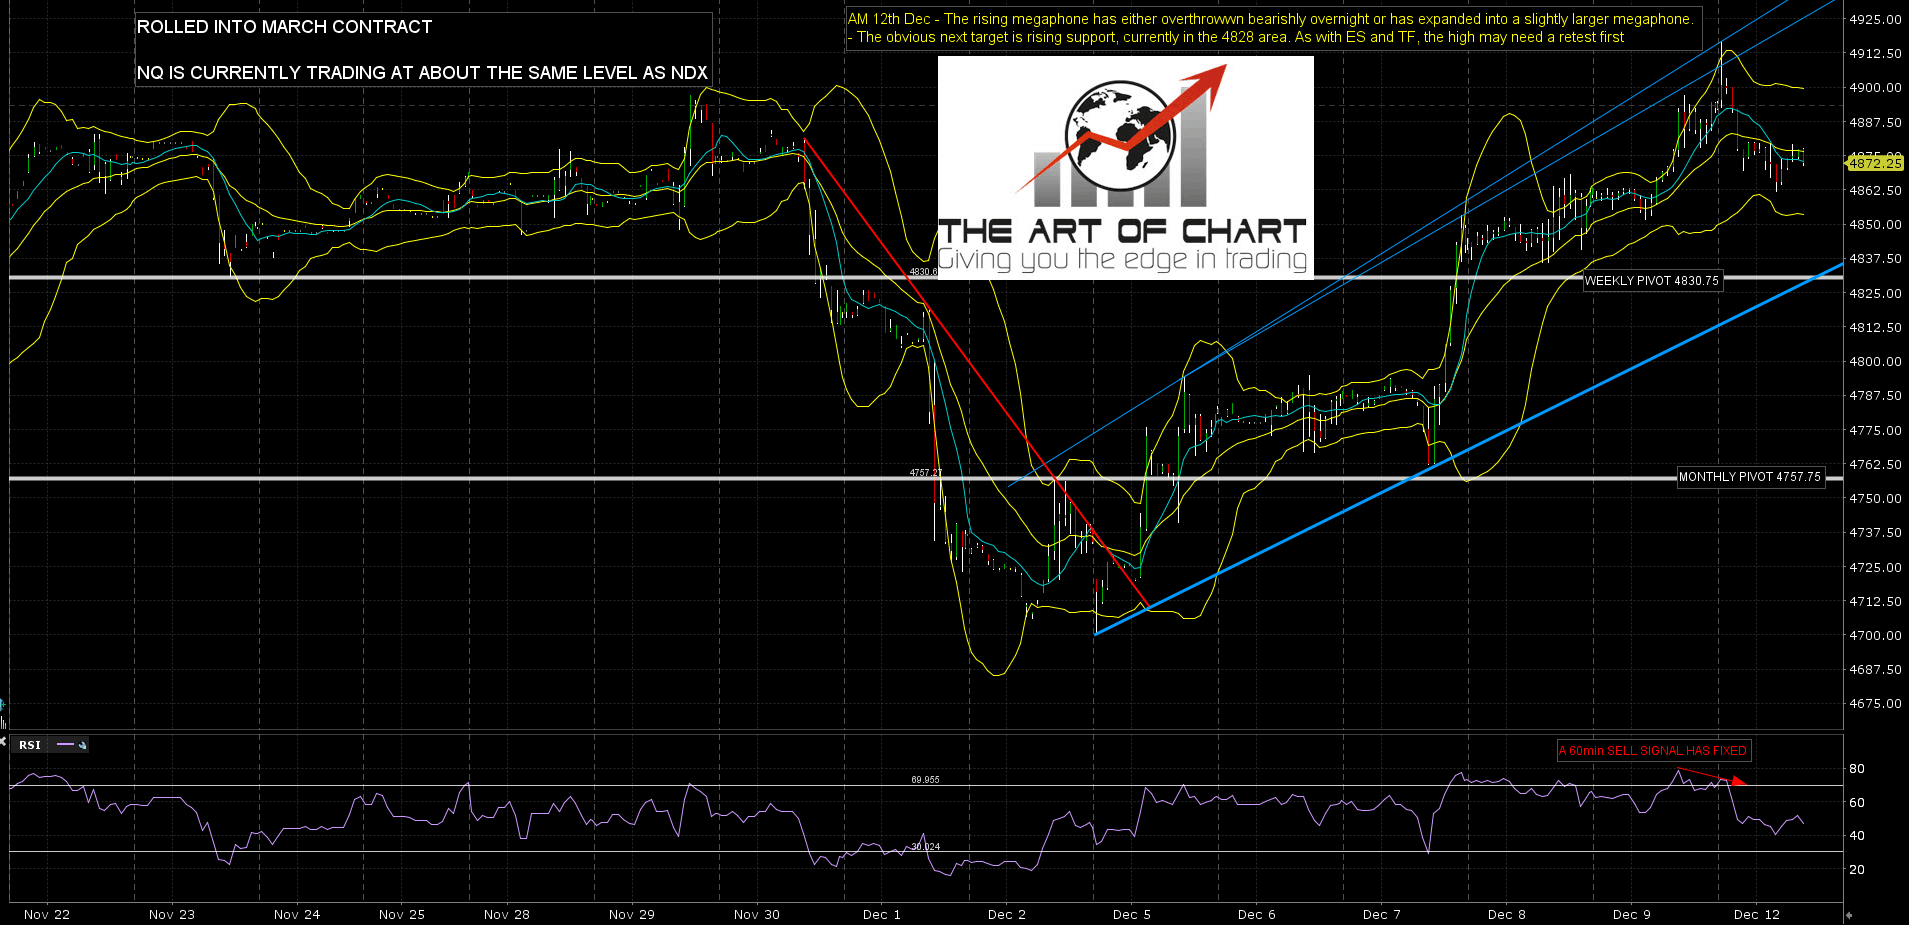
As I’m using futures charts more often now and that’s unlikely to change. I’ve had a couple of queries from readers unfamiliar with the price differential from ES to SPX, NQ to NDX or RUT to TF. I’ve given that some thought and the best place to put the adjustment number is on the charts themselves. I’ve started doing that today and that adjustment number is on each of the charts below. Strangely the adjustment to apply to NQ for the NDX price today appears to be zero. That may well not be the case every day as these do vary a bit.
ES Mar 60min chart:
NQ Mar 60min chart:
TF Mar 60min chart:
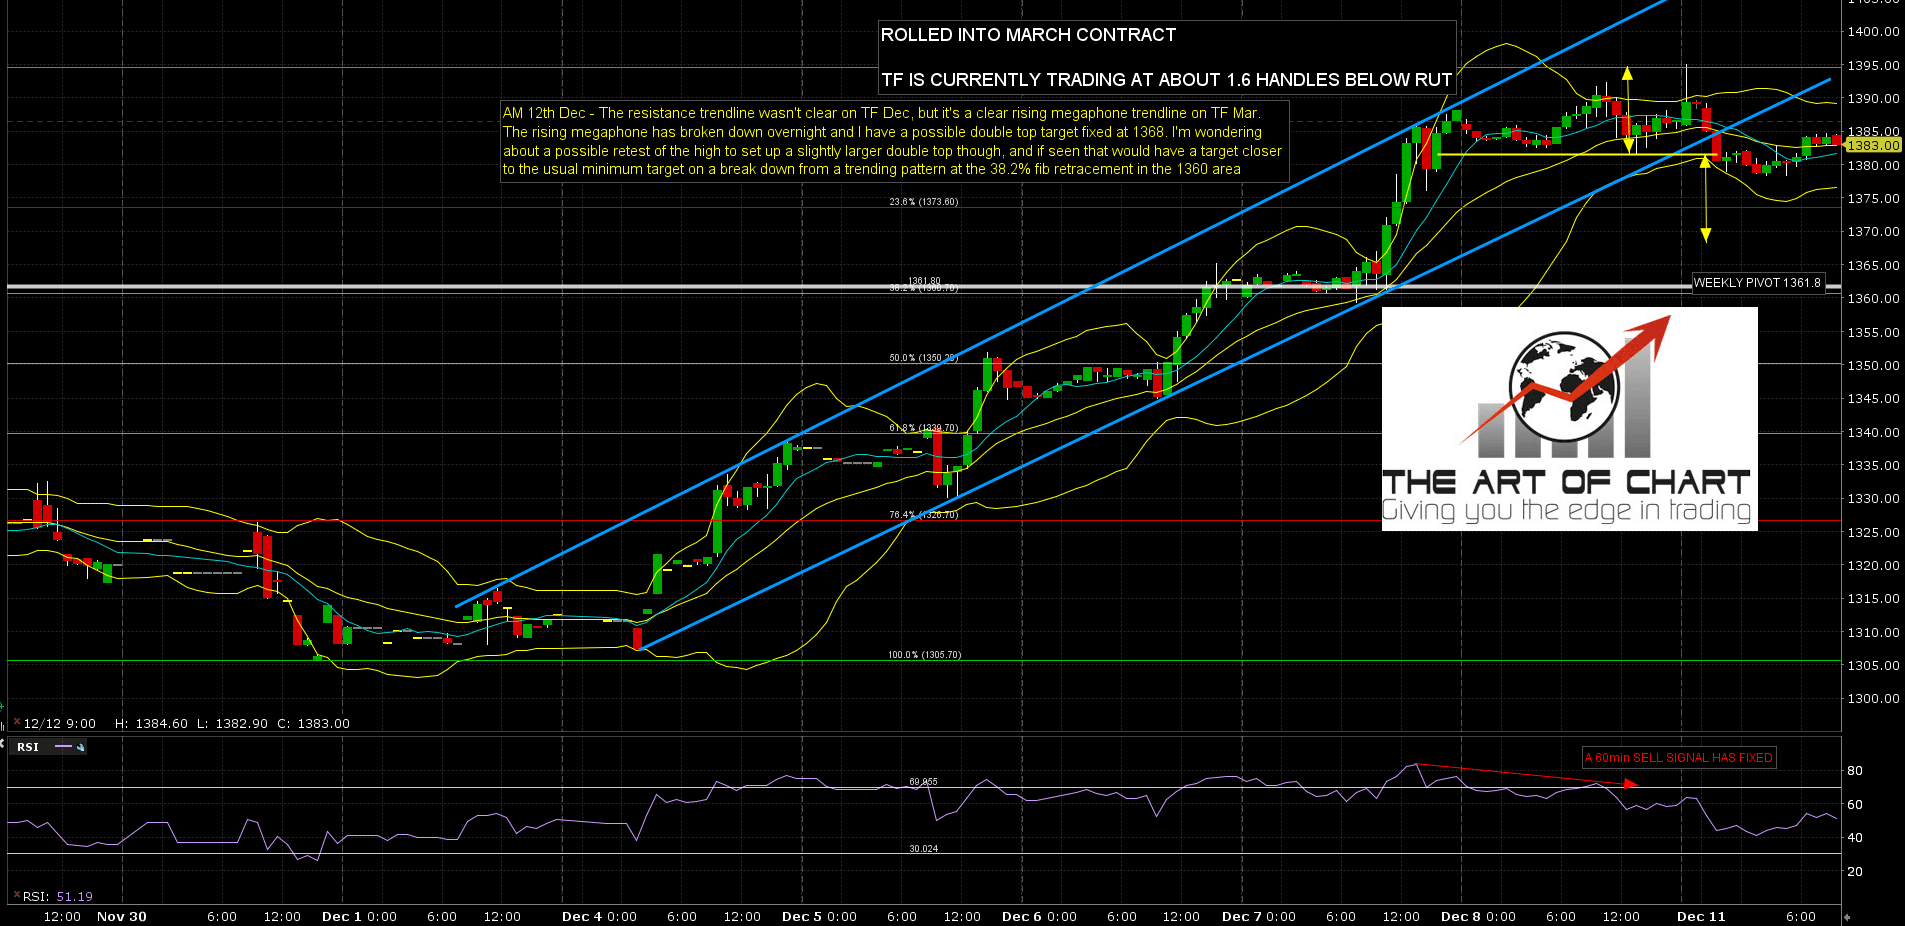
Our working assumption here is that all the three indices are topping out for a modest retracement before the last leg up, and that this swing high should be made before Xmas or at the latest between Xmas and New Year. That may not be true on TF though, as the resistance it is stalled at here is actually the convergence of three resistance trendlines on timeframes running through into the monthly chart. TF may be making that swing high here, and if so will start to underperform the other two, as it was doing on Friday. in that case I’d be thinking TF would just retest the high there on the last leg up for SPX & NDX.
Stan and I are doing webinars with forecasts on a wide variety of instruments for 2017 at theartofchart.net after the closes on Thursday and Friday. These are public and free to all and if you’d like to attend you can sign up for those on this page here.
