
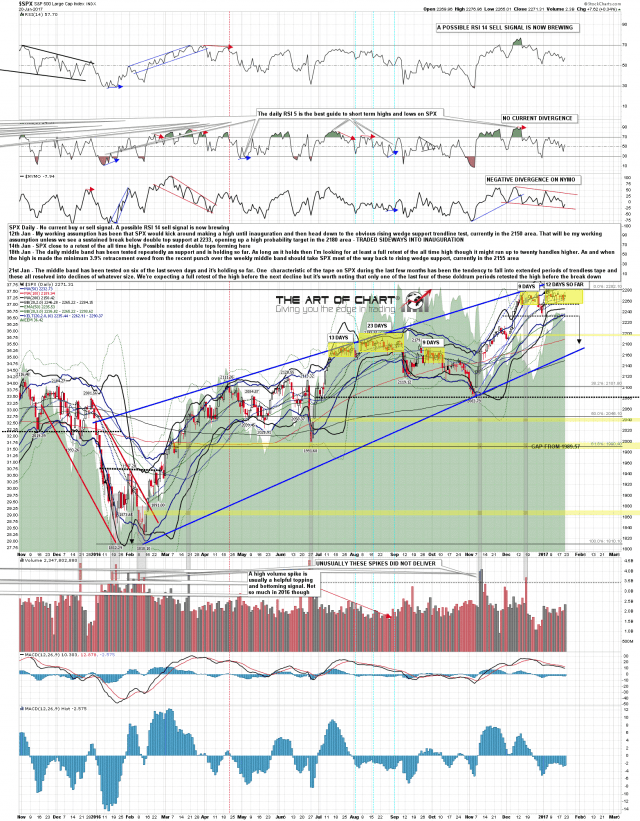
One characteristic feature of the SPX tape over the last few months has been the tendency for the tape to just get lost in space chopping sideways for extended periods. Today is day thirteen of the current range-bound doldrums, and looking back on the others they all resolved into a break down of whatever size, sometimes after a high retest. That’s not encouraging for seeing SPX break much over the current all time high. SPX daily chart:
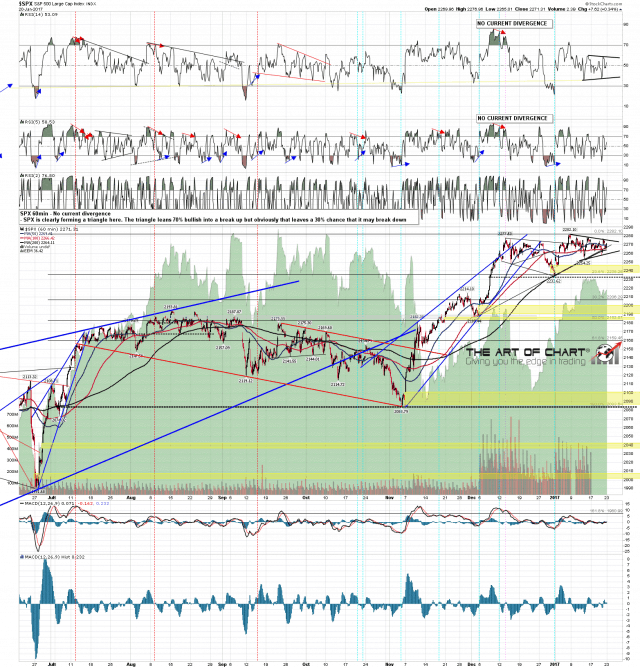
Shorter term SPX is forming a clear triangle with a 70% bullish lean. That fits with a likely high retest coming. We may need to see a test of triangle support, currently in the 2261 (2256/7 ES area) area, before the likely break up. SPX 60min chart:
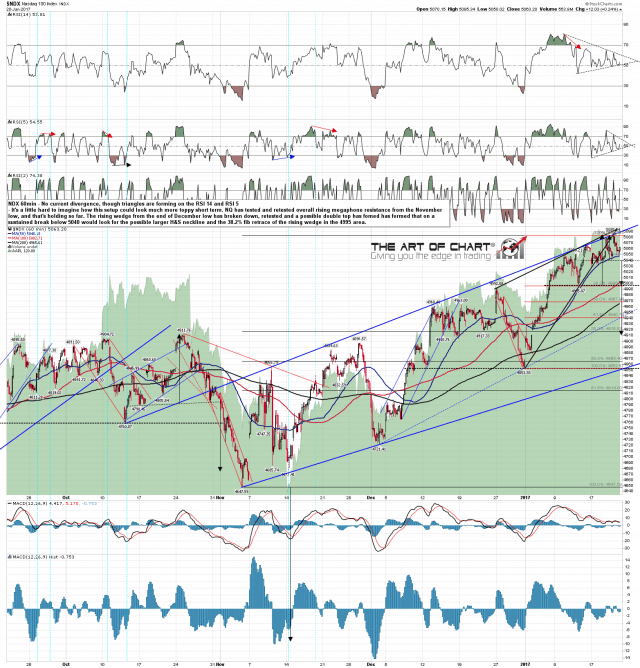
NDX looks extremely toppy here, but looking at our Big Five NDX components, AAPL, AMZN, FB, TSLA and NFLX, the top seems unlikely to be in yet. Expecting some downside short term before higher. NDX 60min chart:
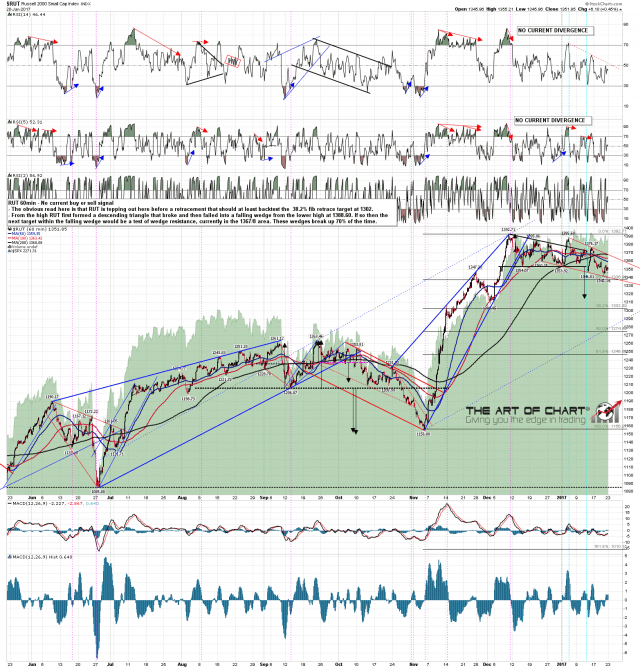
On RUT a complex bull flag (probably) is forming. The current pattern is a falling wedge with the next target within the wedge at wedge resistance, currently in the 1368 area. We might well see a retest of the short term low first. RUT 60min chart:
Stan and I are doing a free educational webinar at theartofchart.net an hour after the close on Thursday on the subject of ‘Technical Patters you can profit from’. If you’d like to attend you can register for that on this page here.
