
Apologies for the intermittent updates over the last couple of weeks. It’s been very busy and I’m hoping to get back to posting every day again next week.
So another round of new highs and I read that the Vix has fallen to a 24 year low this week. There is an emerging consensus that equity indices will never drop meaningfully again and SPX and NDX are getting close to some big round numbers in the 6000 and 2500 areas respectively that are likely to develop a magnetic pull the closer SPX and NDX get to testing them.
So is it time to write off the bears altogether? Well we’ll still likely see at least retracements when the setups are right for them and as it happens the retracement setups are looking pretty good right here, though to develop negative divergence on the daily charts we would likely see retracements and then marginal new all time highs on both before any larger move. Those marginal new all time highs, at this point, could test those big numbers at 2500 and 6000.
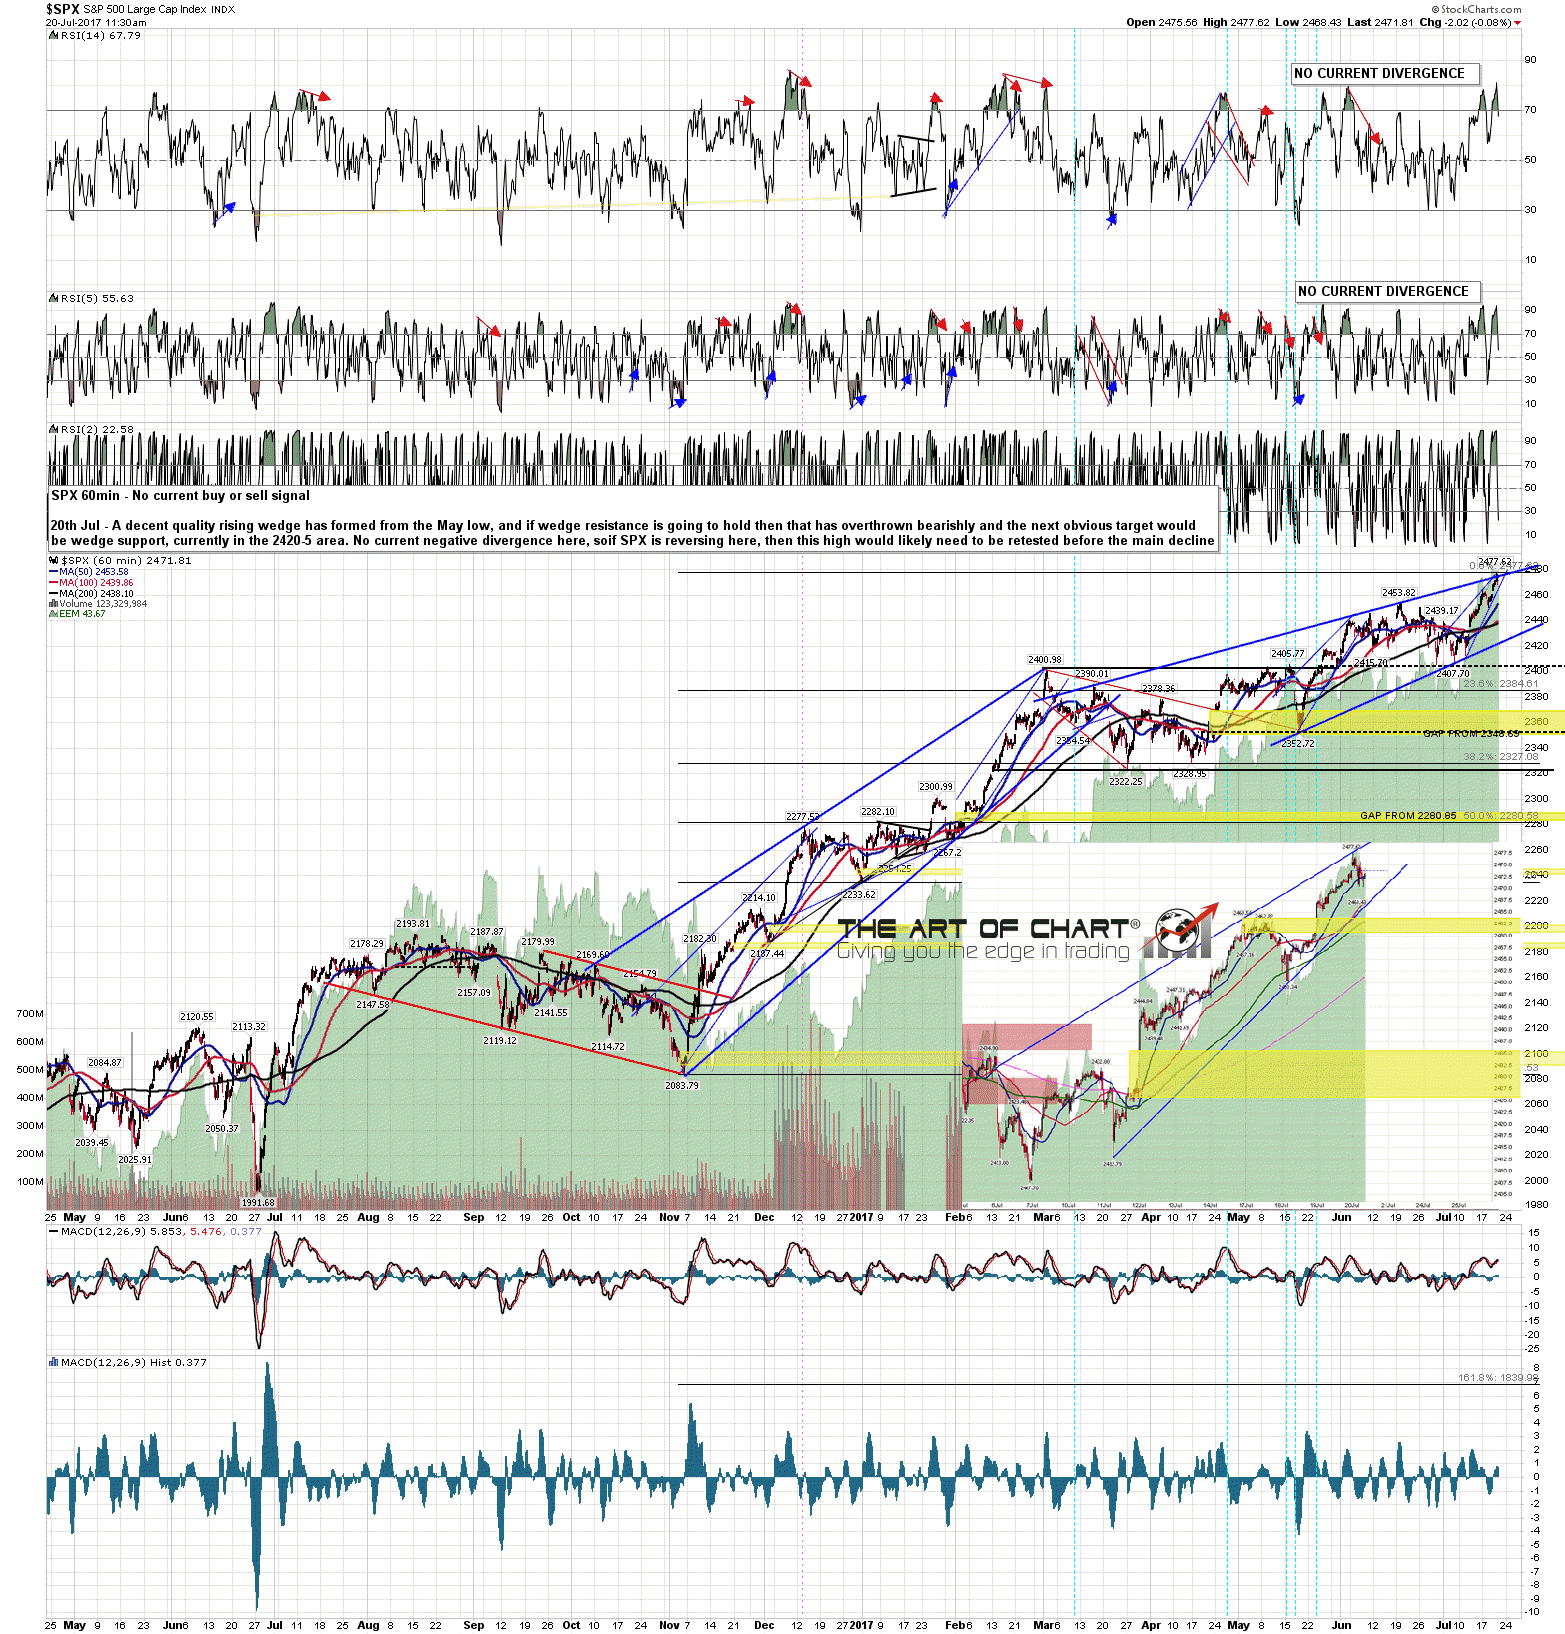
The move from the last low has formed a decent little rising wedge that has taken SPX to resistance on a decently formed larger rising wedge from the March/April lows. No negative divergence on the hourly or daily charts. SPX 60min chart:
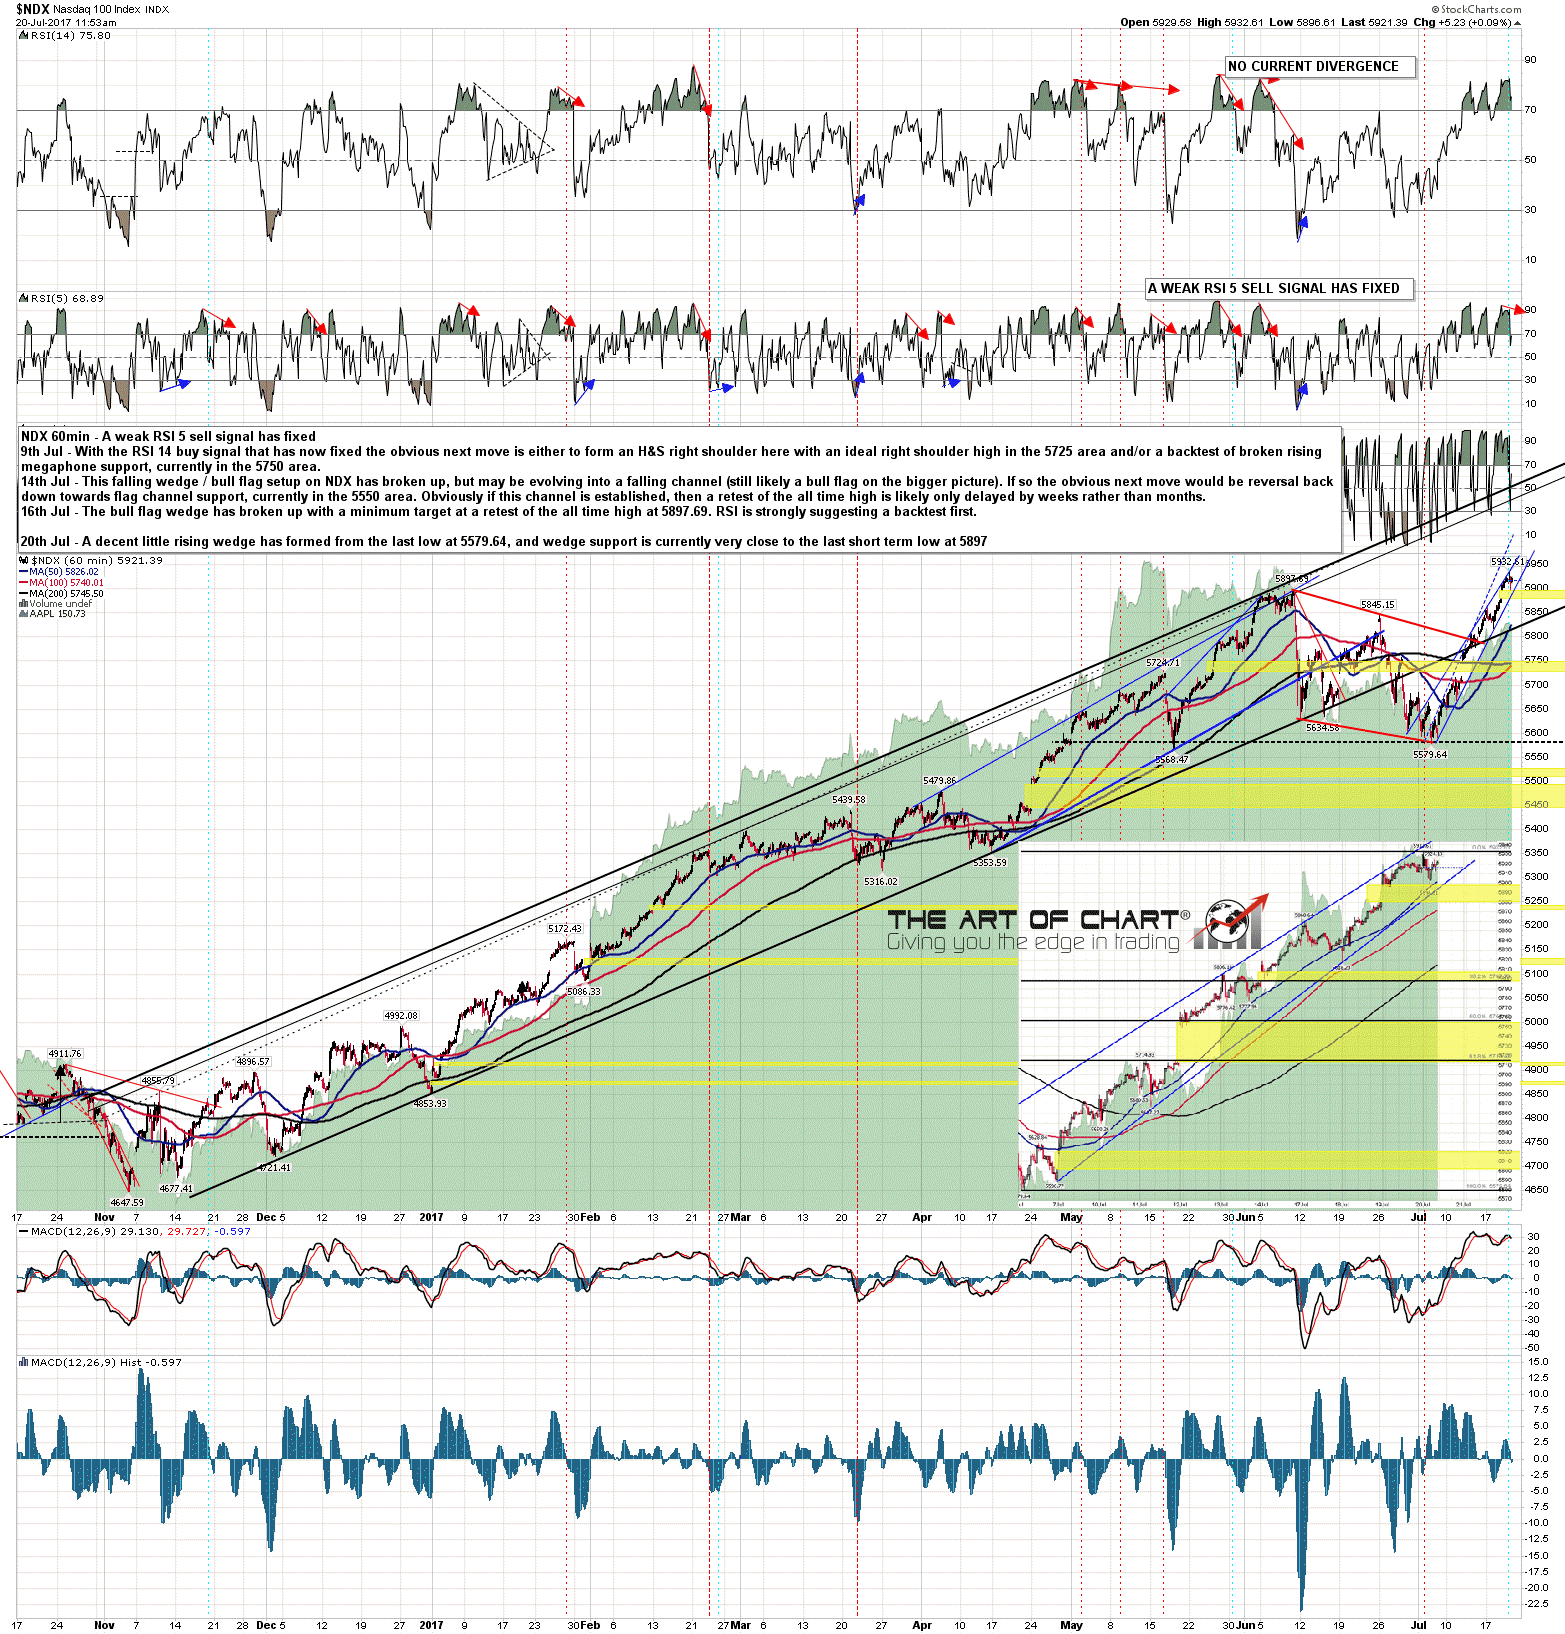
The setup isn’t as bearish on NDX, but there is a decent rising wedge from the last lows which is very steep and likely to need at least a retracement soon to establish a less vertiginously steep support trendline. NDX 60min chart:
The ES, NQ and TF futures charts below were done an hour after the RTH open for Daily Video Service subscribers at theartofchart.net. If you are interested in trying our services a 30 day free trial is available here.
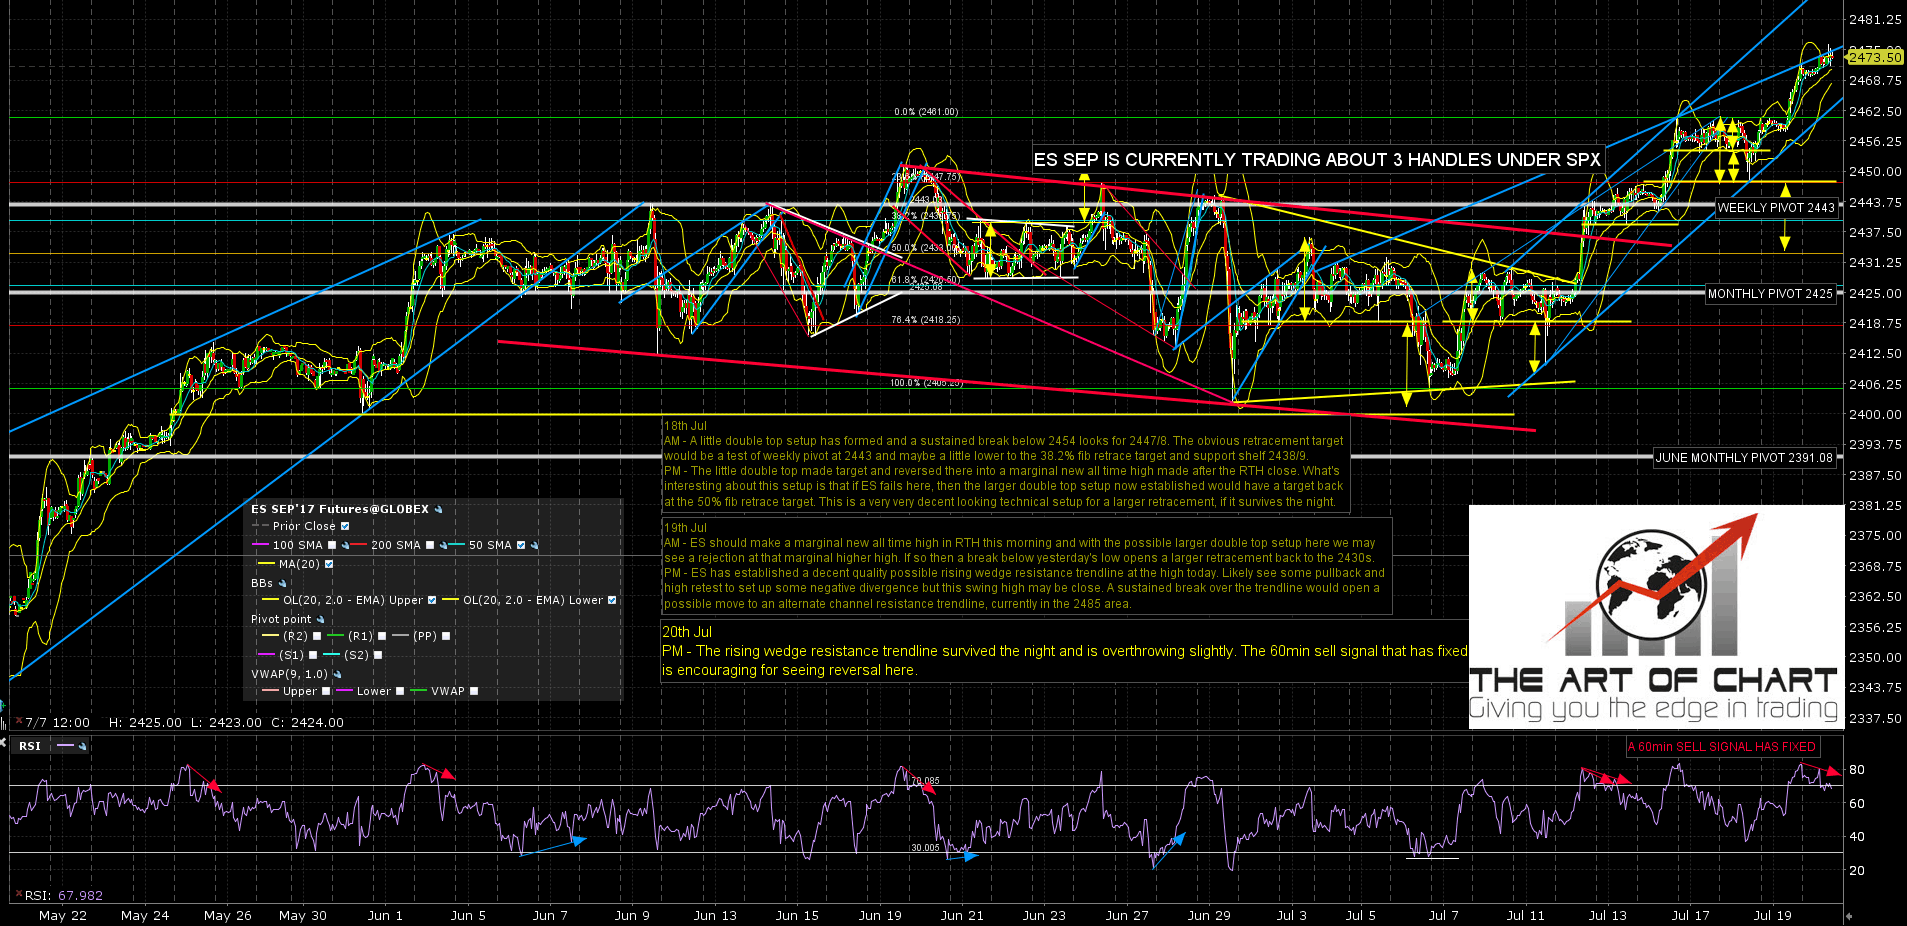
On the futures charts the negative divergence here is much more encouraging. I updated these charts an hour after the open today as by then 60min sell signals had fixed on all of ES, NQ & TF.
ES has slightly overthrown wedge resistance on a decent rising wedge from the last low. In the event of a sustained break over wedge resistance I do have an alternate channel option with channel resistance currently in the 2490 area. ES Sep 60min chart:
On NQ there is a similar rising wedge, with the wedge resistance trendline somewhat weakened by two overthrows rather than just one. Again there is a decent alternate trendline above but if there hadn’t already been a 60min sell signal fixed, another would have fixed this morning. NQ Sep 60min chart:

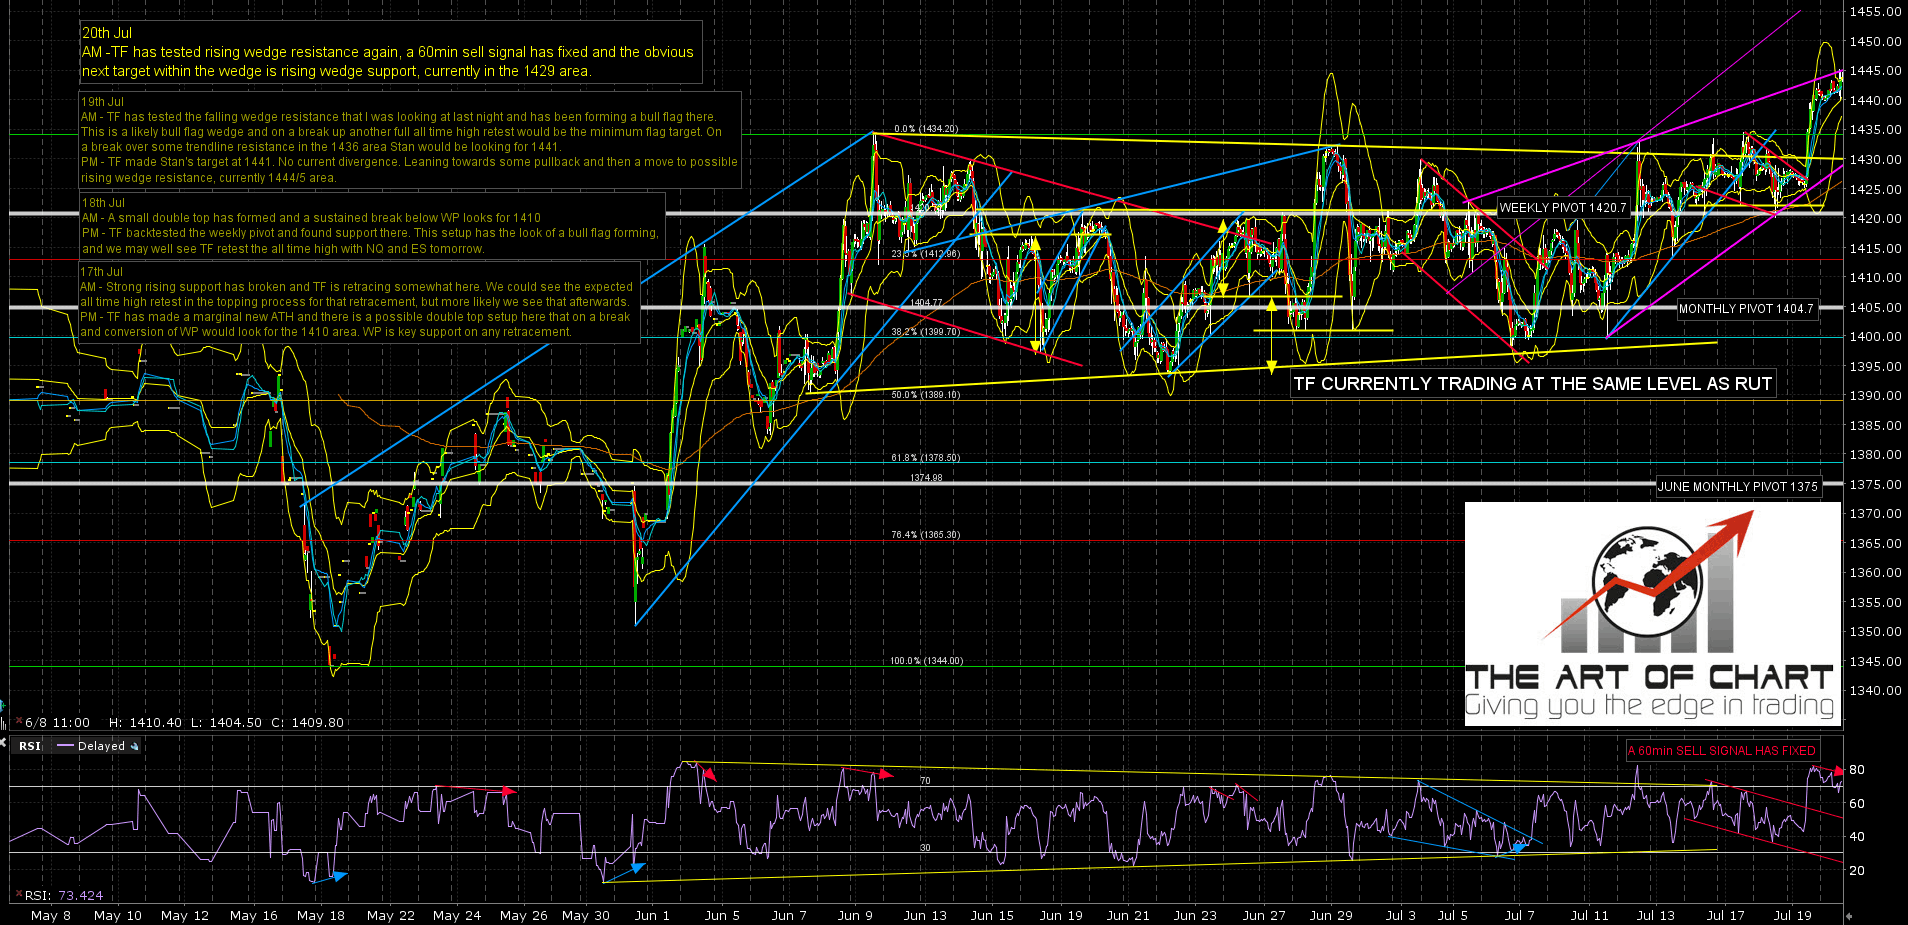
Decent looking rising wedge on TF too. TF Sep 60min chart:
This is a very decent looking retracement setup, probably not quite cooked yet. I’ll be keeping a close eye on it.
