I remember it like it was yesterday. But it was yesterday……..plus nine years. That is, September 19, 2008. I was at Prophet’s office, and the CEO of thinkorswim, Lee Barba, was visiting. I had sold Prophet to Investools (its prior name) in early 2005, and Lee would come visit us from time to time to check in, share ideas, and catch up.
The market had been roiled off and on in the first nine months of 2008, and the team of Bernanke and Paulson had enough. During the trading day, several gargantuan initiatives were announced, including TARP and the banning of short-selling in about 800 stocks. (You may notice during the multi-hundred percent gain of the past eight years, no one has suggested banning BUYING stocks. But I digress).
Anyway, the reaction was immediate and ferocious. In the span of just two days, the Dow Industirals exploded 780 points higher, and with the big, bad bears banned, it seemed that Wall Street’s eleven-month dip in stocks was at an end.
It wasn’t:
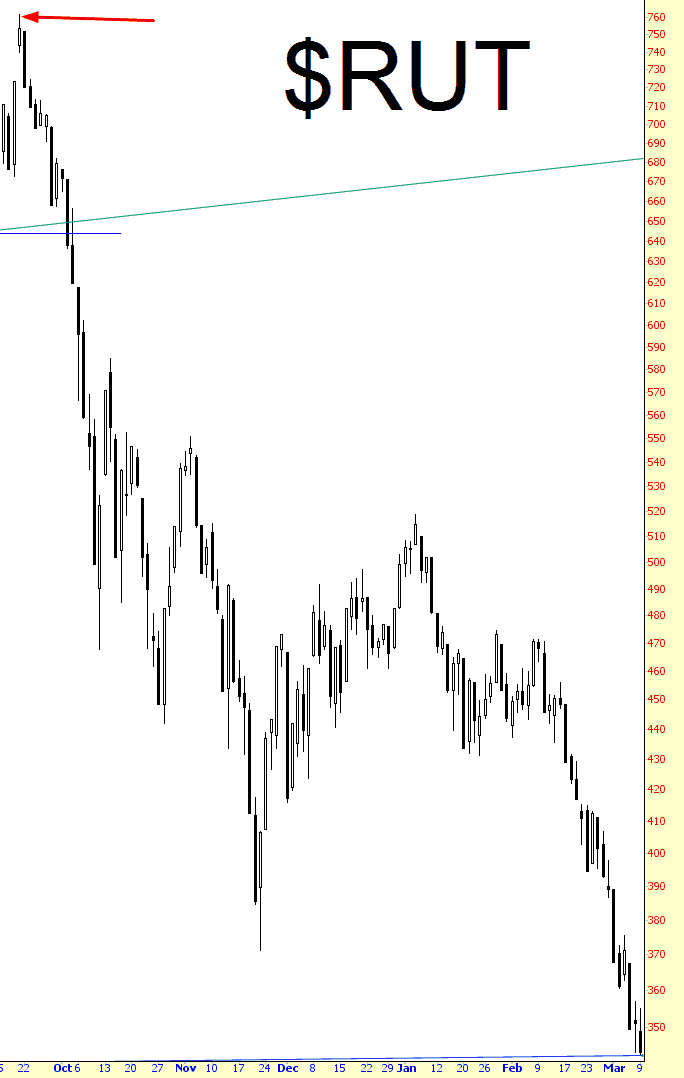
Now I realize the graph shown above may not seem real. After all, the Russell 2000 had already lost 12% of its peak value. Wasn’t that enough pain? How could it be that another 55% would be destroyed from the index? Wasn’t that, like, illegal or something?
Nope, boys and girls, it really did happen. See, in those days, price discovery was actually permitted, and market drops were not limited to 1% every month or two. You could actually get sustained bear markets (for those of you unacquainted with this tear, it rhymes with “fair targets”, and it is presumed to be an extinct phenomenon).
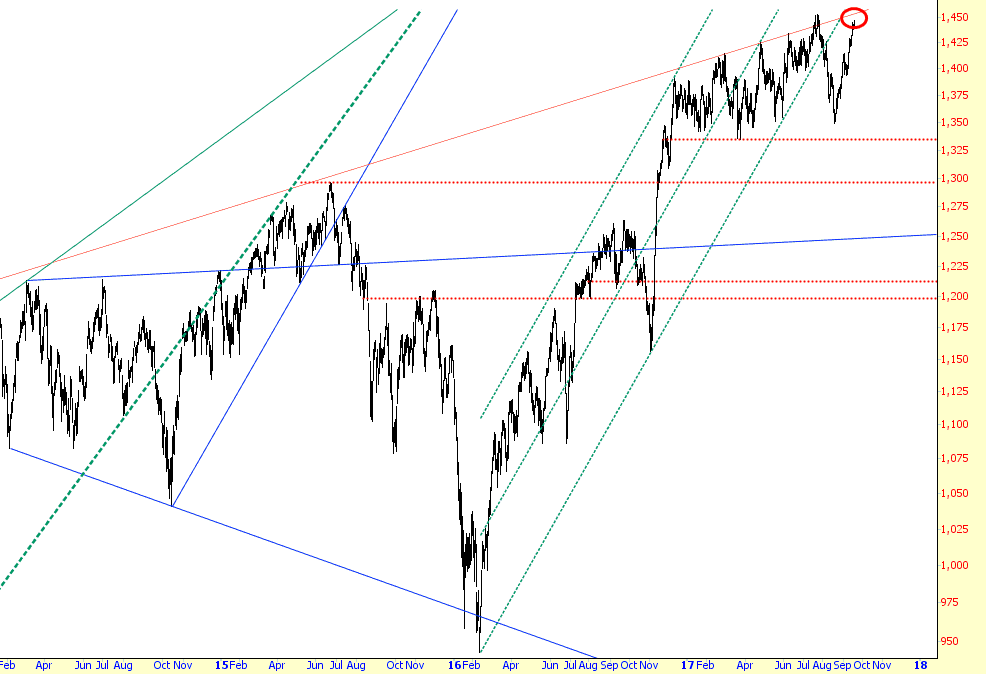
Of course, these days, the Russell isn’t suffering quite as much. In fact, irrespective of nuclear missiles, political crises, or hurricanes, it goes up pretty much every day. Indeed, today is closed 314% higher than the chart shown above.
Today was itself rather momentous, in the fact that the Fed finally took its $4.5 trillion punch bowl away. Now that the Fed party is over, did stocks plunge? Umm, no. The VIX is at a 9-handle, and even as I am typing this, the ES is green during after-hours trading.
I doubt there’s a single bear on the planet left at this point, except for poor, insane Tim, but I’ll at least leave you with this longer-term chart of the $RUT, which shows that we’re getting very close to a trendline which, at least so far, has proven a formidable barrier. But I’m not holding my breath.