
 In last year’s market outlook for 2017, I anticipated a rise of around 11% in U.S. equities, in general, to place the S&P 500 Index at just above the 2400 level by the end of the year (my post was written on December 1, 2016, so my calculations and forecast hadn’t incorporated a further 80-point rally that occurred during that month until year-end).
In my post of November 26, 2016, I was projecting a rally in the SPX to around 2700 by the next U.S. Presidential election in 2020. Markets have certainly been much more robust this year than I anticipated, as this level has almost been hit already. It rallied to an all-time high of 2657.74 on November 30 and closed on December 1 at 2642.22.
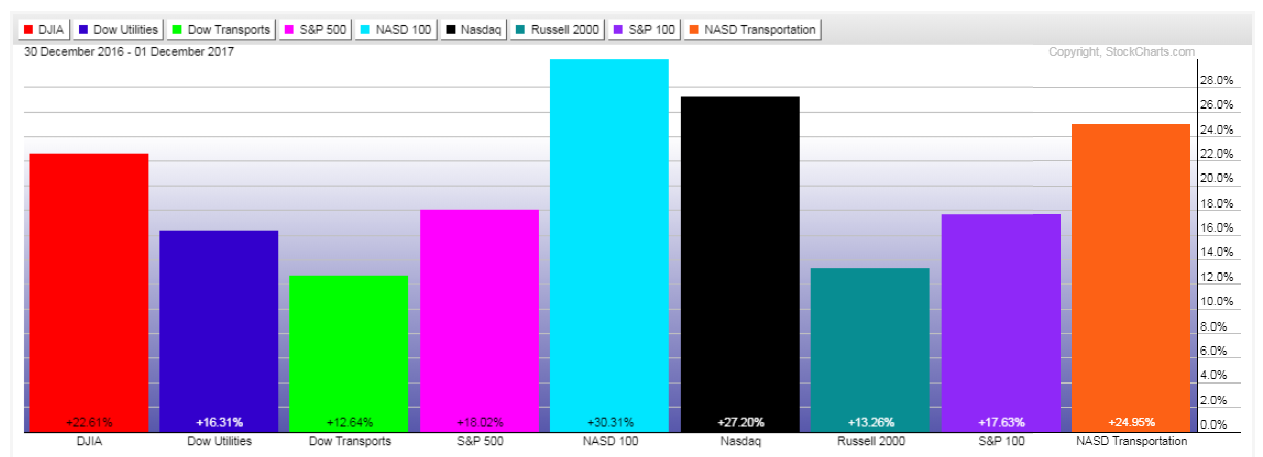
At the time of writing this post on December 2, you will see that, of the 9 Major Indices, the S&P 500 Index has gained 18.02% year-to-date, as shown on the first graph below, while the Nasdaq 100 and Nasdaq Composite Indices have gained the most, and the Russell 2000 and Dow Transport Indices the least.
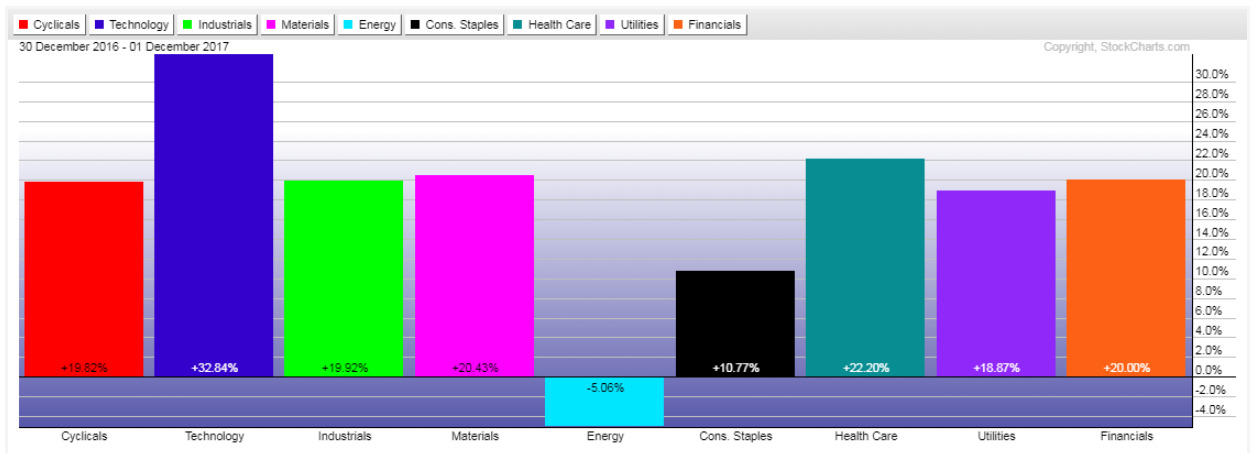
With regard to the 9 Major Sectors, Technology has gained the most year-to-date at 32.84%, with six others at around 20%. Consumer Staples gained 10.77%, while Energy has far underperformed at -5.06%.
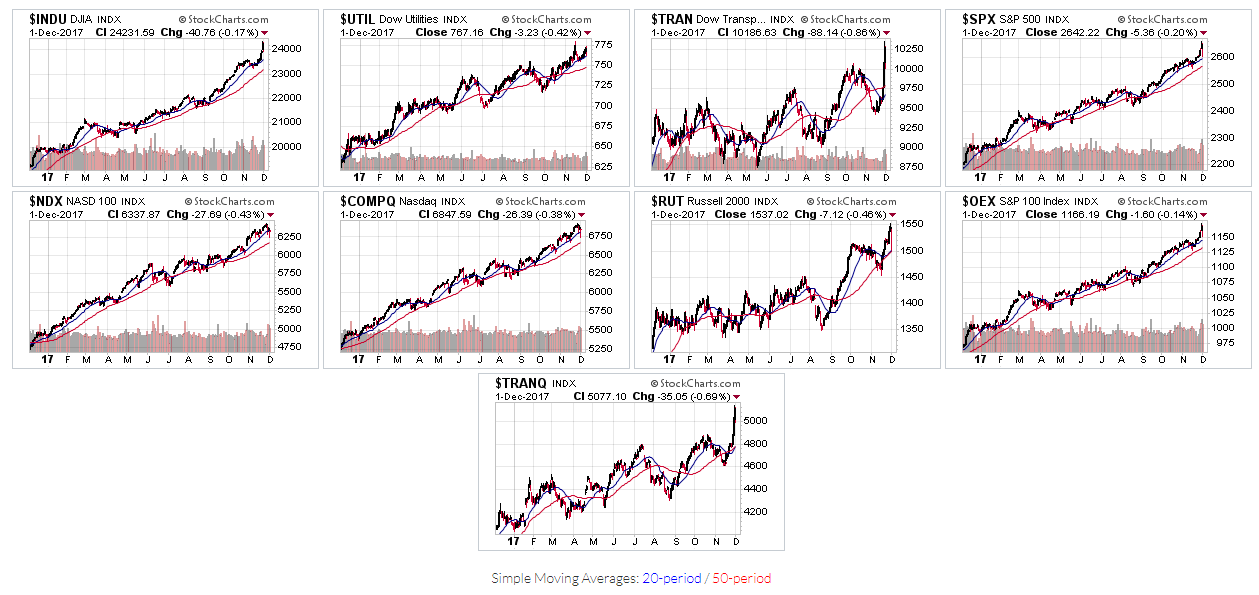
All of these Indices and Sectors are currently trading, either above, or well above, their 50-day moving averages, as shown on the following 1-year daily charts.

Without repeating myself with respect to three articles that I posted recently, I’d just direct your attention to the conclusions that I made here regarding the Tech Sector (XLK), Consumer Cyclicals (XLY) and Consumer Staples (XLP) in connection with strengthening/weakening consumer spending into year-end and next year, as well as effects from potential upcoming Fed interest rate hike(s).
Additionally, I’d re-iterate the comments I made here regarding world money flow in the U.S. Financials, versus European and Chinese Financials and their respective major resistance levels.
Finally, please note the comments I made here regarding the (actual past and potential future) effects of political legal machinations and political legislative drama on the SPX and VIX, and their price/technical levels to monitor in the week(s) ahead.
CONCLUSIONS:
I understand that tax cuts contained in the Senate tax bill (that was just passed on December 2) don’t begin until 2019. If this time frame is agreed to by the House and ratified by the entire Congress by the end of this year, we may see markets take some hefty profits in early 2018, in protest, as, no doubt, they were expecting them to take effect in 2018, judging by this year’s hot market.
If this scenario were to happen and, taking into consideration the uncertainty that next year’s mid-term elections will bring, coupled with likely interest rate hikes, I’d project that we’ll likely see volatility rise in 2018 and the SPX (and the other 8 Major Indices) gain only about half of what they gained this year. This would mean an approximate increase of 10% for the SPX. I expect Technology to remain fairly strong, and Small-Caps may struggle more than Big-Caps. Nonetheless, I anticipate that the U.S. markets will continue to outperform other World markets (keep an eye on the performance of their Financials, as I noted).
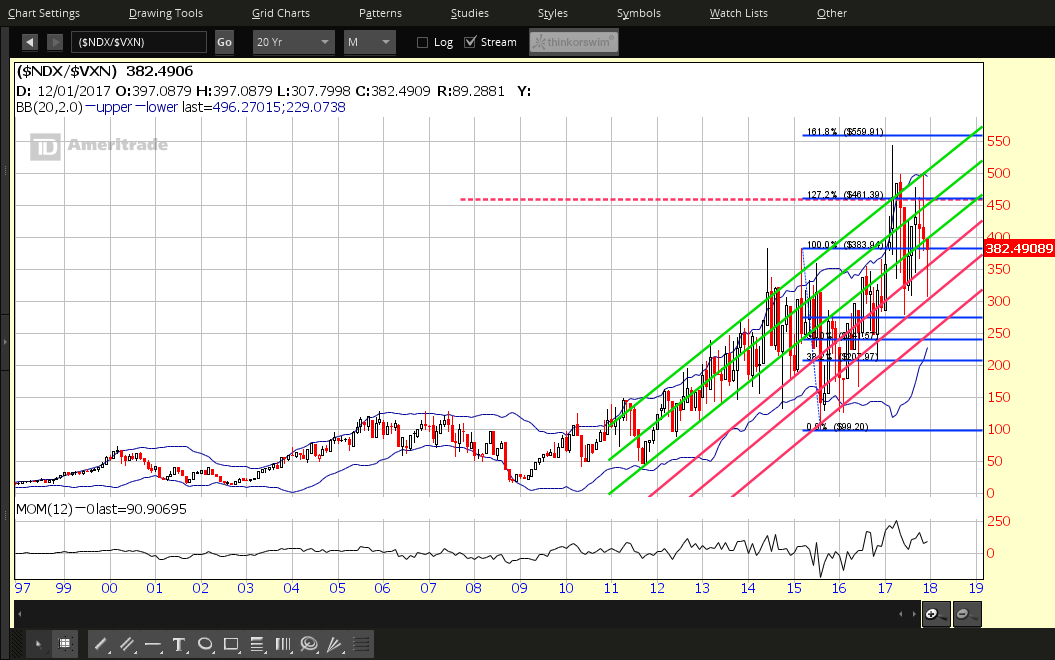
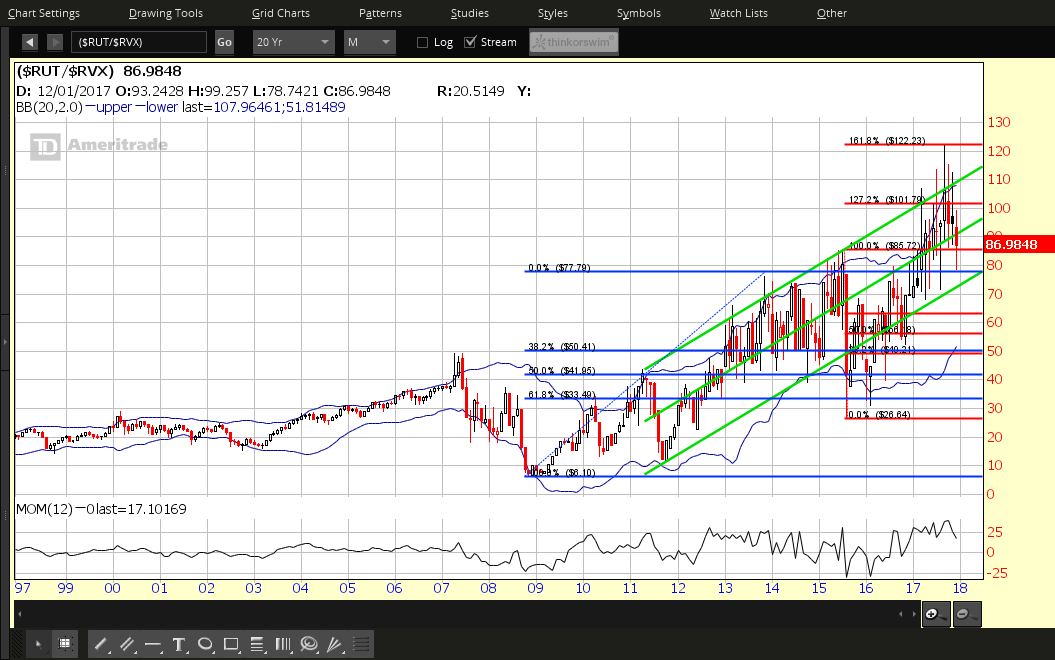
With respect to the S&P 500, Nasdaq 100, and Russell 2000 Indices, I’d watch to see whether the following major support levels can be held on the following Index/Volatility ratios (note their corresponding Monthly ratio charts below)…a breach of those important levels could produce the sell-off that I mentioned above:
- SPX:VIX Ratio — 200
- NDX:VXN Ratio — 350
- RUT:RVX Ratio — 80

Good luck next year!
