
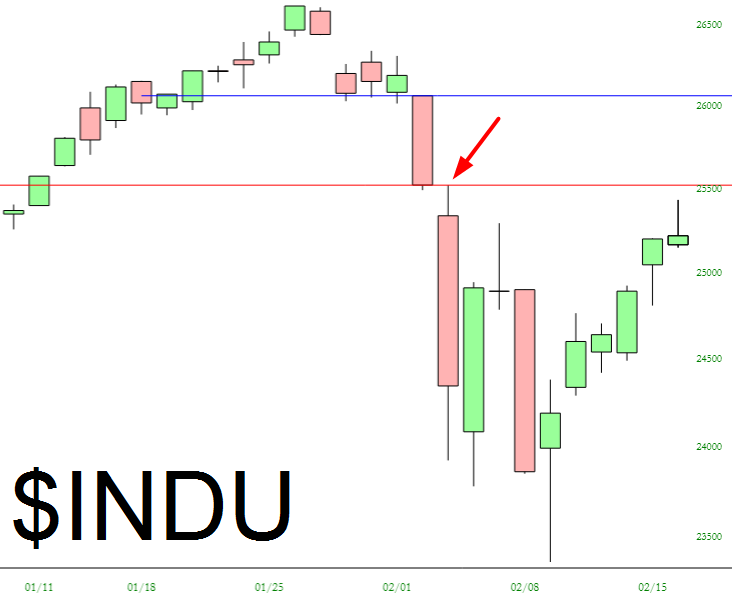
I cannot shake the feeling that the market gods are trying to trick me. I keep looking at these charts and wondering to myself, “there is NO WAY they are going to make it this obvious.” Because during the depths of the sell-off, the “obvious” move was a rally to the low 25000s on the Dow, which is exactly what happened. Now that we’ve recovered about 62% of the drop, the next obvious move is another plunge, taking out the lows from early February. If by some miracle that transpires, I will fall over backwards at how easy it SHOULD have been to trade (I’m too much of a worrywart to aggressively position myself, in spite of the aforementioned obviousness).
Here’s the DIA ETF, for instance. We’ve got a perfect shooting star reversal formation on Friday, and we’ve come full circle on the retrace back to where the serious fall commenced (at the arrow).
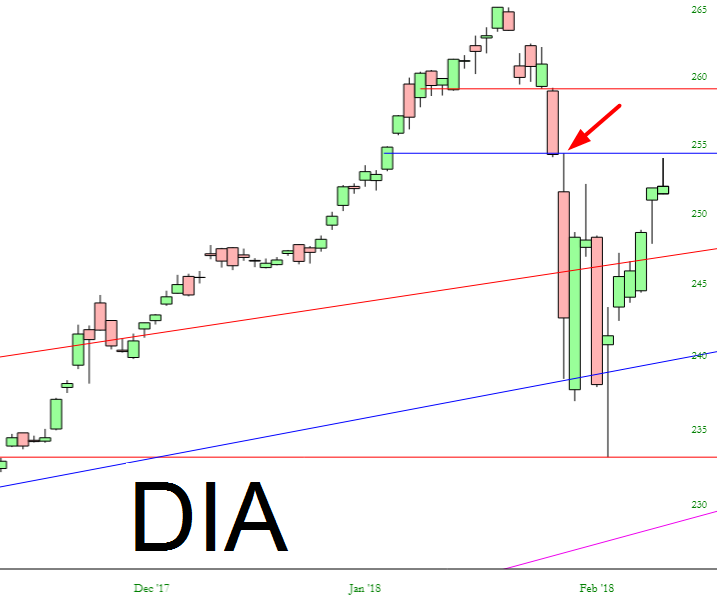
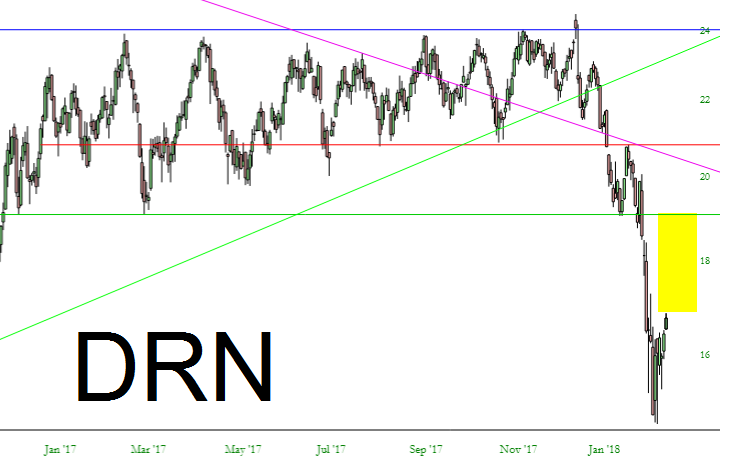
I guess one asterisk in this is that real estate has only partly recovered. Hypothetically, it could keep fighting its way up through this yellow tint before it hits a lead wall.
That aside, though, virtually every ETF looks the same: a clear top, a hard fall ,and a swift recovery back to the underside of the same top. And, as icing on the cake, that same shooting star pattern I mentioned earlier.
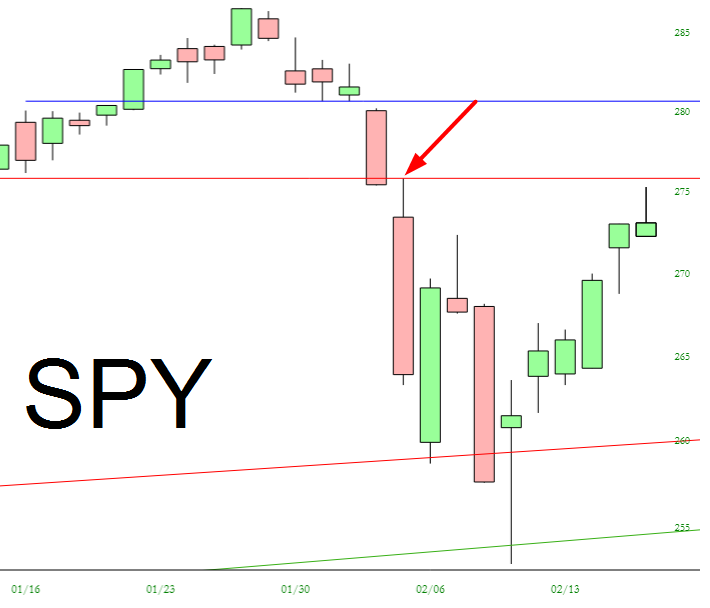
One last one, just to drive the point home (for obviously reasons, with a remarkable resemblance to DIA):
If I were the devil-may-care type, I would have put every ounce of buying power into short positions at Friday’s close. But I’m quite concerned about the devil caring, so I’m only about 130% short in my normal portfolio and merely 50% short (by way of puts) in my options account.
