I have an extremely cool new feature for you SlopeCharts folks out there: earnings dates charts. This will be of particular interest to you options traders. Allow me to explain………..
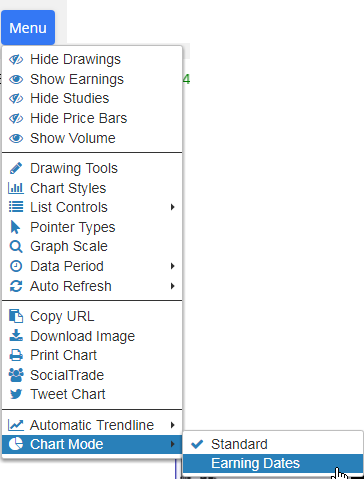
What we’ve done is merged together historical stock data with earnings announcements so you can see how a stock behaves as it approaches its earnings day. By default, we show you every day for twenty days in advance of earnings, as well as the day of and the day after earnings (you can change how many days via a dropdown). Using it, as with all things SlopeCharts, is simple. Just choose the Earnings Dates item from the new Chart Mode menu item:


