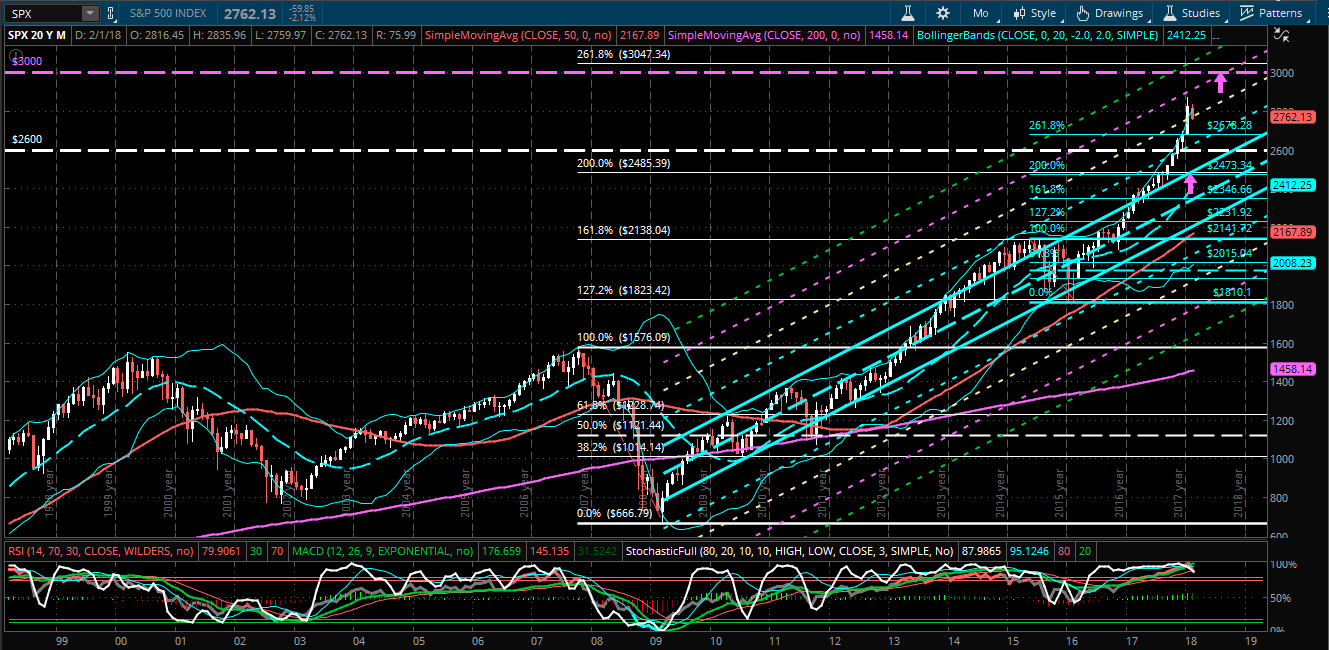
Just a quick heads-up to mention that major support for the SPX sits between 2525 and 2485, as shown on the following daily and monthly charts.
There is a convergence of the 200-day moving average with two trendlines at 2525 on the daily chart, and, more importantly, a convergence of two external Fibonacci retracement levels with the +1 standard deviation level of a long-term uptrending regression channel at 2485 on the monthly chart.
If we see a major sell-off in equities, we may see price, ultimately, fall to somewhere around 2500 (a 10% drop from Friday’s close) before it stabilizes. Keep an eye on the FAANGs +5, as I more fully outlined here, as well as the 10YRT, as I described here and here. Further weakness in the FAANGs + 5, together with continued rising rates in the 10YRT, could very well propel such a drop in the SPX to that level, or lower.