A little addition we made in the wee hours of the morning was this menu item, which is available to everyone:
Slope of Hope Blog Posts
Slope initially began as a blog, so this is where most of the website’s content resides. Here we have tens of thousands of posts dating back over a decade. These are listed in reverse chronological order. Click on any category icon below to see posts tagged with that particular subject, or click on a word in the category cloud on the right side of the screen for more specific choices.

Political Headwinds Await US Markets
As economic benefits of last year’s Tax Cuts and Jobs Act begin to filter into the US economy, the S&P 500 Index appears to be headed towards a retest of its all-time high of 2872.87 set in January of this year, as shown on the monthly chart below. This record high was accompanied by an all-time momentum (MOM) high, as well…hinting of further strength ahead at some point on this timeframe.
It has broken above what was near-term resistance of 2680 (as I described in my post of May 4).
Watch for a break and hold above its next major resistance level (top of long-term uptrending channel) at 2750. Otherwise, a break and hold below 2680 could see price retest its next support level of 2620, or lower.

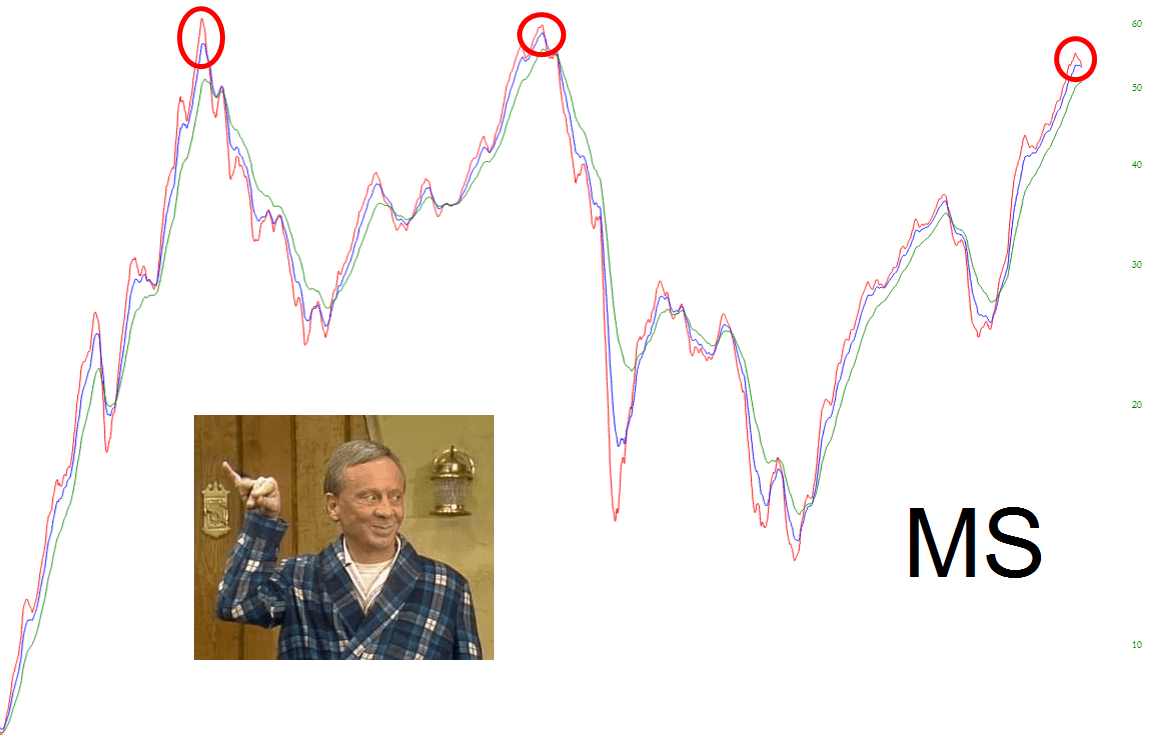
Stanley!
I think it’s worth noting the broad cycles that Morgan Stanley has had over many years. Below I’ve shown (with a bit of help from Mr. Roper) what the moving averages have illustrated about Morgan’s moves over the decades. To my eyes, it seems to have peaked, as it has twice before.
Pulse of the City
As visual a group as Slopers are, I thought many of you would appreciate this hour-by-hour, day-by-day view of how Manhattan is populated. It’s pretty cool.
Straight from the Heart
What an utter pleasure and joy it was to spend the day looking at charts, doing posts, and not having a single emergency. Good God almighty, I can’t tell you how good it felt.
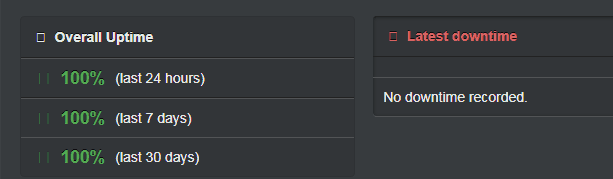
And our server pool did a yeoman’s job without any nastiness (and, yes, that CPU load peaked at 700%). (more…)
