Happy Sunday, everyone. Well, the launch of the new site has gone decently so far. We still have some issues – – a couple of fairly major ones, in fact – – but in the same way that many of the improvements on the site are “under the hood’ and unknown to most users, likewise these lingering problems are invisible or imperceptible to most of you.
All the same, Sunday for me and my guys is slated to addressing these last items before the trading week begins. I am, as some like to say, cautiously optimistic.
Yet I can’t spend the entire weekend doing new site announcements. Let me share a few words about the big indexes as we enter a new trading week.
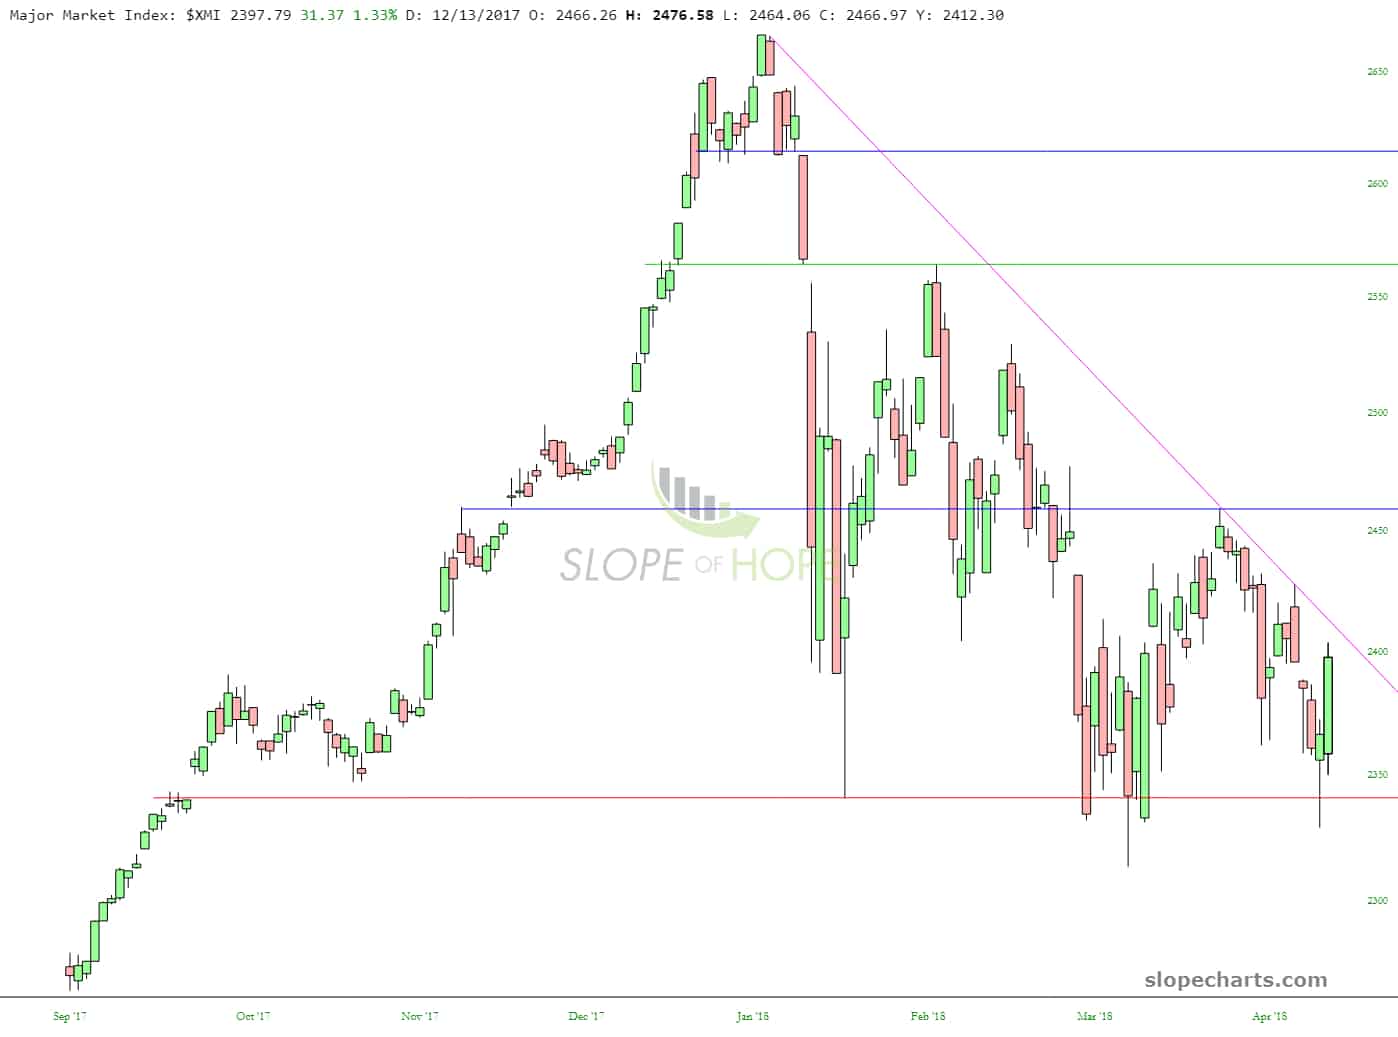
First up is the Major Market Index which exhibits the exact same pattern that is virtually omnipresent in equity markets: (1) a peak at the end of January followed by (2) lower lows and (3) lower highs. Of substantial concern to me is that there might be a double bottom which took place in early February and just last week (it’s plain to see we didn’t get another “lower low”). The rally on Friday was powerful, and I’m wringing my hands over whether that descending trendline holds.
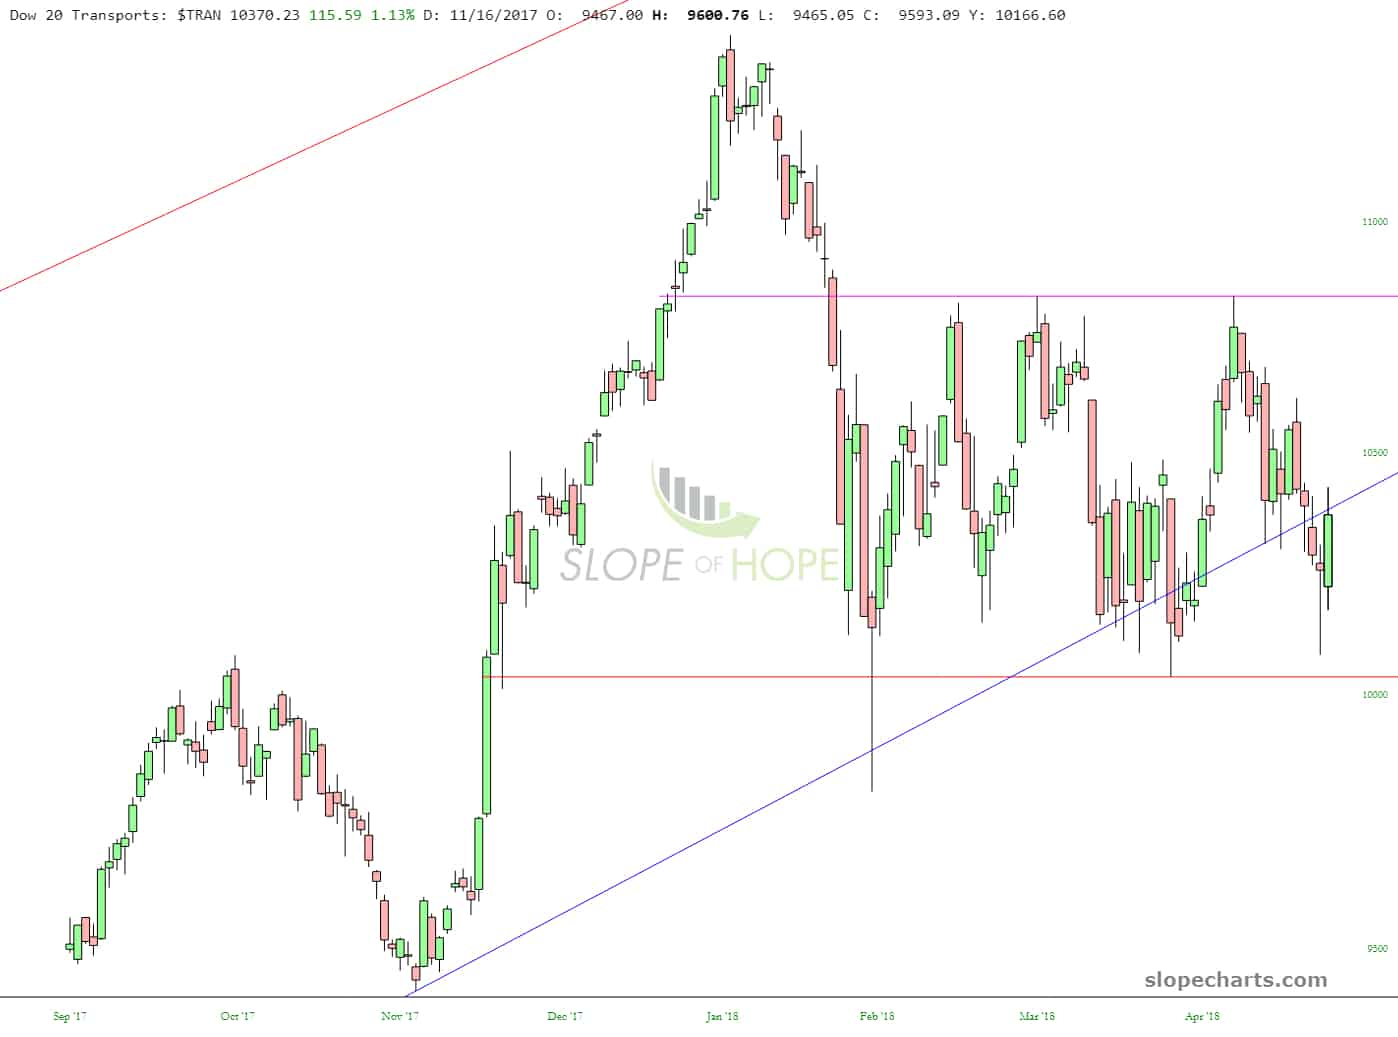
Next up is the Transportation Index, which I find terribly interesting since it is causing some serious damage to its supporting trendline. You can see how clearly range-bound it has been for the past few months.
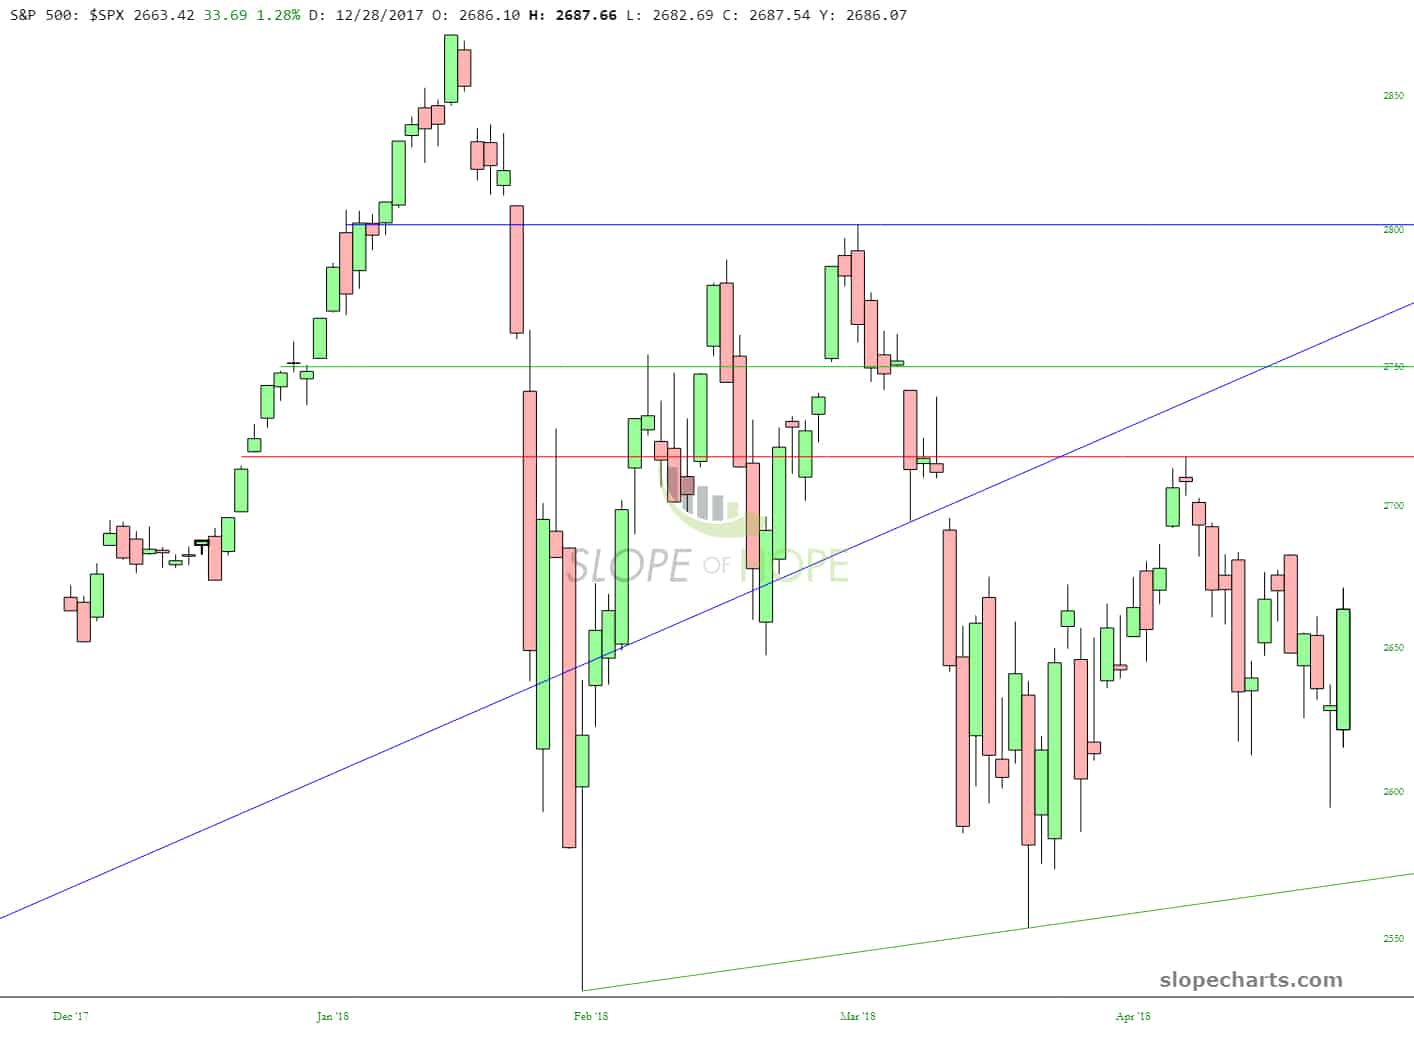
The S&P 500 has been “stuck” as well (let’s face it, the market has been pretty frustrating for both sides all year long). Yes, the lower highs are in place, but at the same time, higher lows – – which leads to a symmetric triangle formation. It’s a brutal tug-of-war, as last week’s violent rally illustrated.
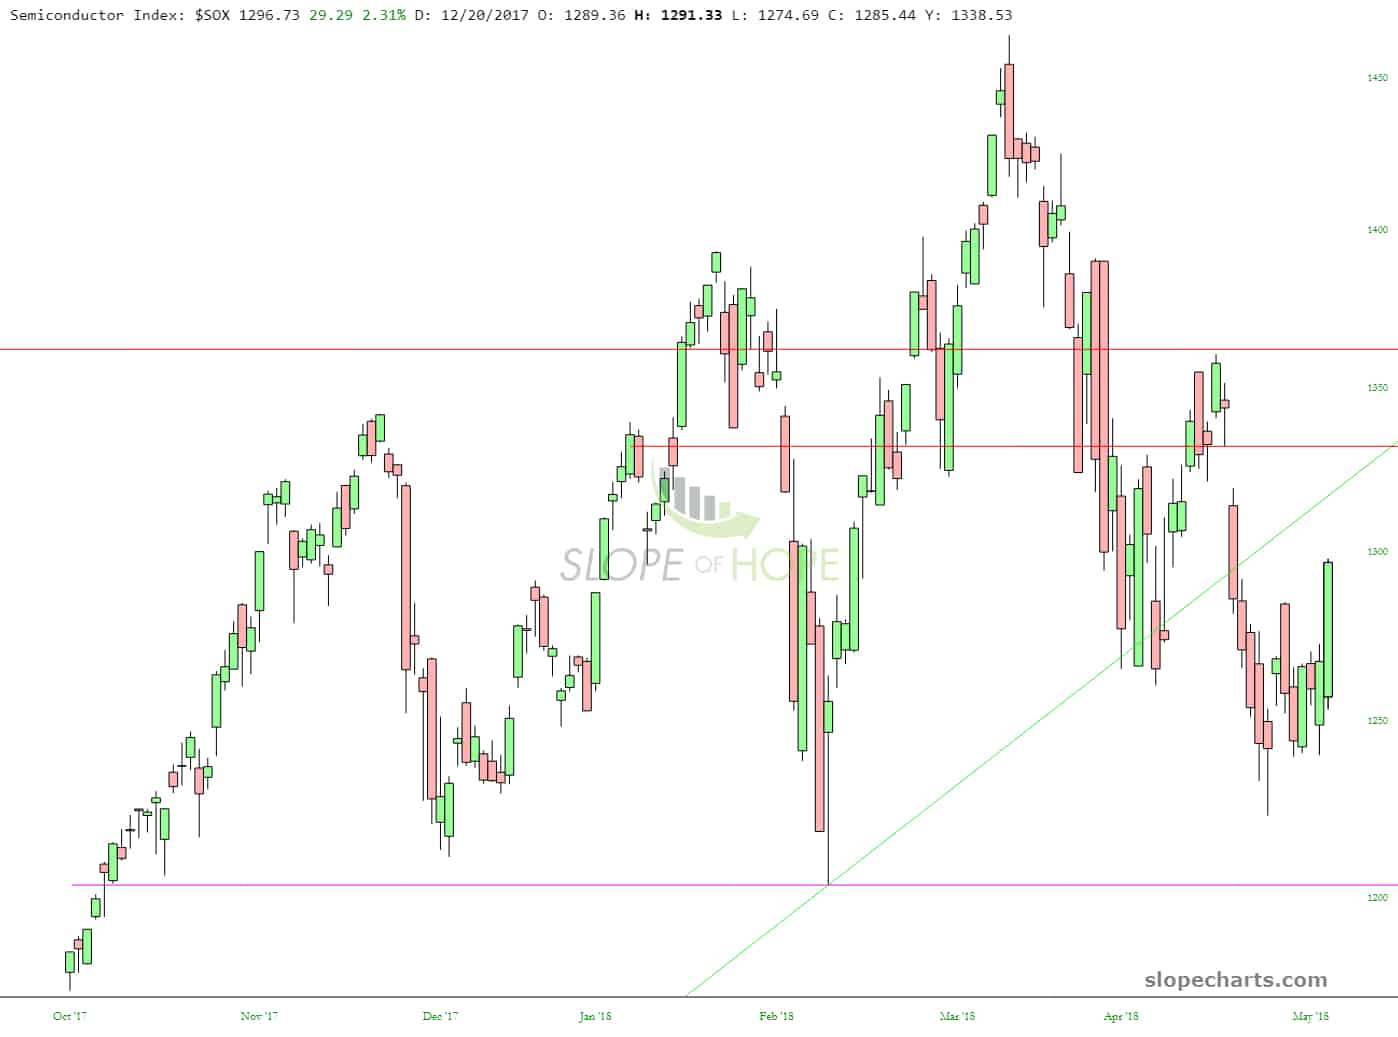
The semiconductor index is an easier read (and it’s an important sector, since so much of the NASDAQ’s success has been anchored to the likes of Intel and Nvidia). Take note of the gap down, which that horizontal line is anchored on. Further take note of how last week’s rally is pushing prices toward that gap as well as to the underbelly of the now-broken uptrend.
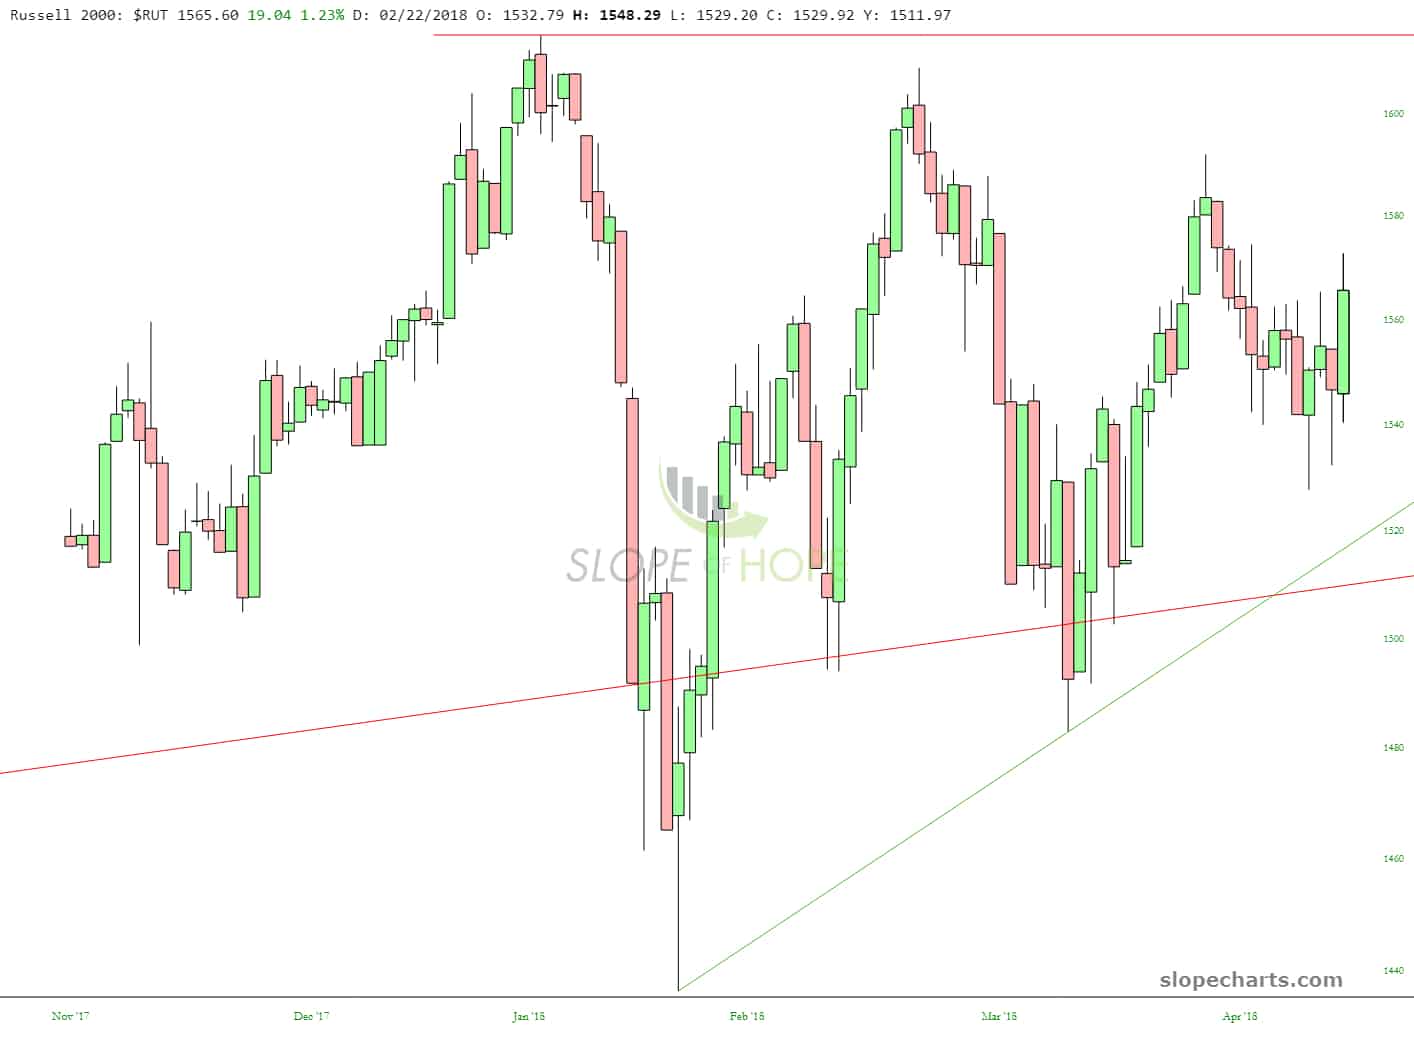
The Russell 2000 small caps, like the S&P 500, is “compressing” with lower highs and higher lows. This sine-wave formation is getting less energetic, and as we enter the fading days of the earnings season, I have to wonder what is going to snap it out of the doldrums. Neither bulls nor bears can claim victory for 2018. Every few days, it seems the baton is passed back to the opposition.
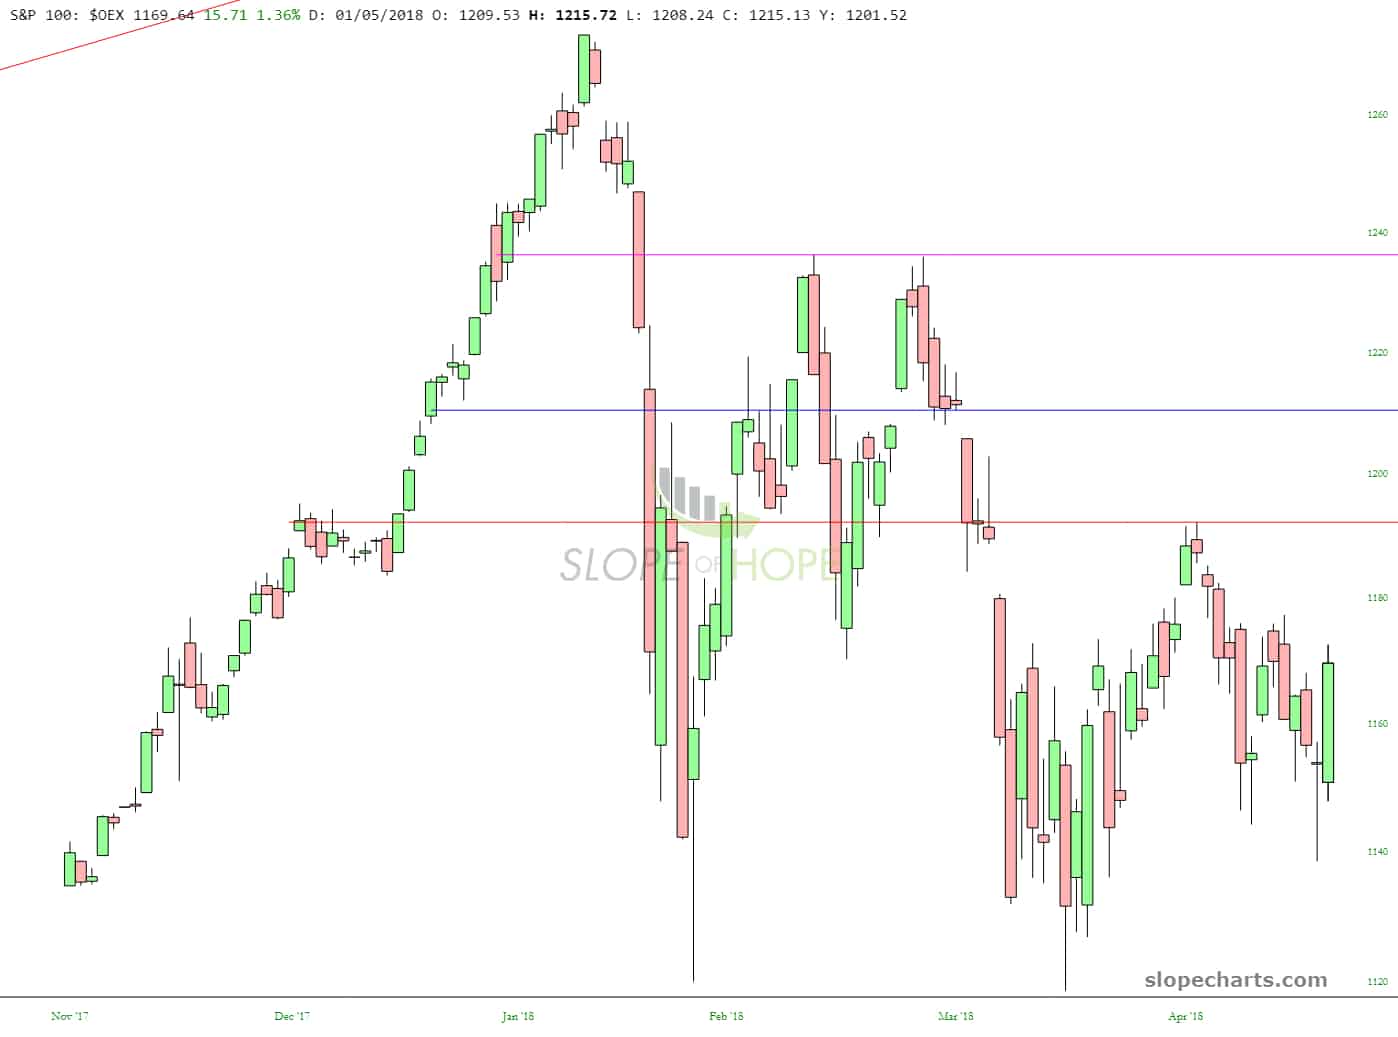
Here we have the more narrow S&P 100 which has closed its last big gap and whose three horizontals make plain how this elevator has been lurching down to lower levels, one by one. As long as it stays below that recovery peak (that is, the lowest horizontal), the bulls are on their back heels.
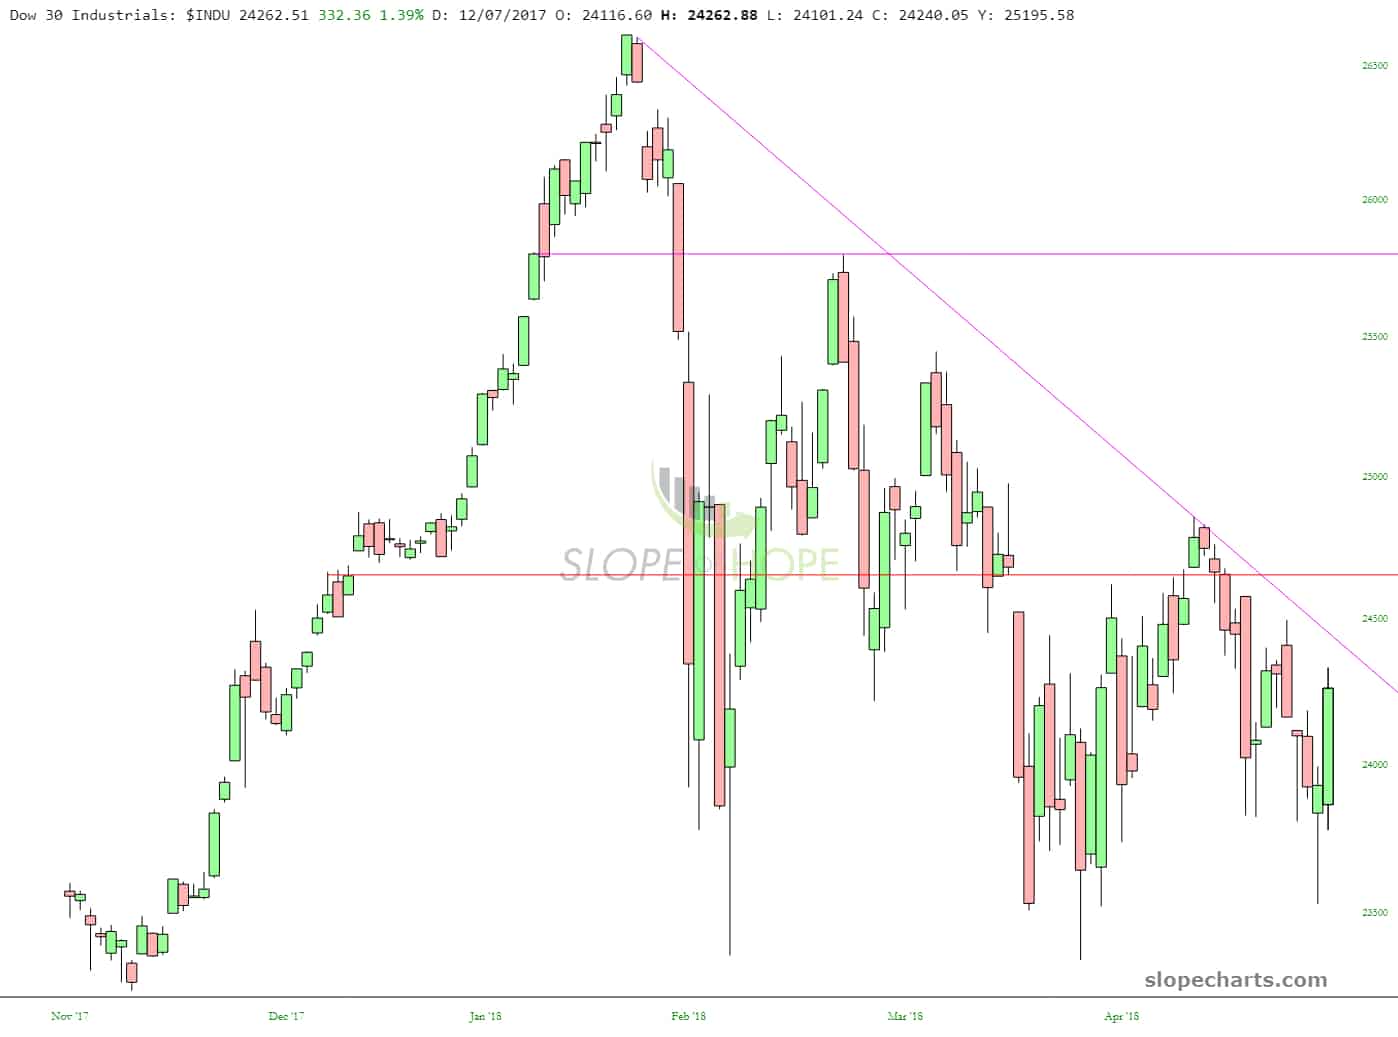
Might as well see the big boys – the Dow 30 – too, where our principal focus needs to remain on that descending trendline, which has contained prices since the peak.
The NASDAQ likewise needs to stay beneath its recovery high. I haven’t drawn the lines here, but I fear the beautiful diamond pattern I had drawn is now wrecked, thanks to Friday. Ah, well.

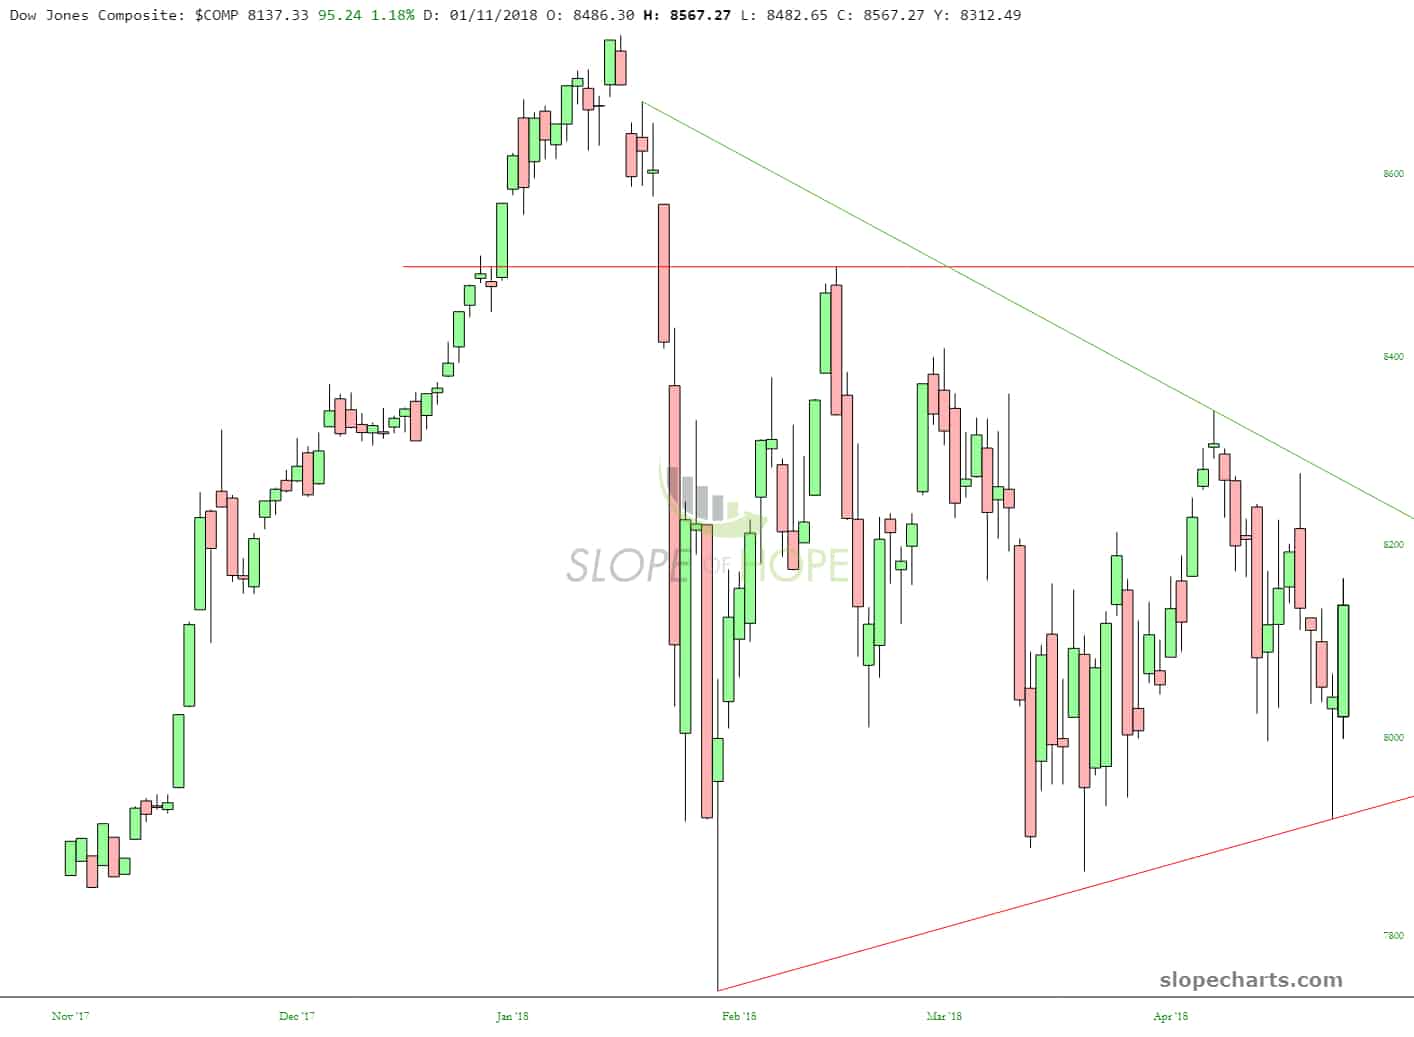
Lastly, here’s the Dow Jones Composite, whose triangle pattern has daintily hemmed in the price action since late January. The tightening price band, by definition, makes clear a resolution is coming soon.
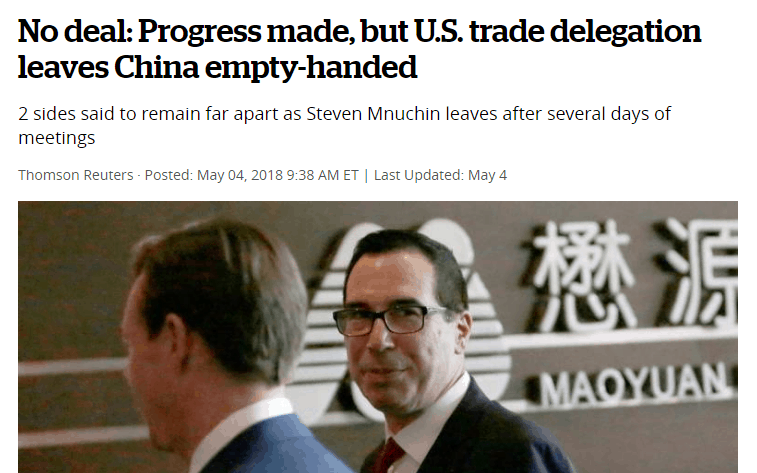
I’d also like to note something which is getting surprisingly little coverage – – a big impetus behind last week’s rally was the “positive” progress made with Chinese tariff talks. Well the delegation has returned from their travels with a giant nothing-burger. Why ZH isn’t featuring this news prominently is beyond me, but here it is: