Seeing this table over on ZH made my jaw just about drop:

The stock market has been going up over three thousand four hundred days. Three thousand. Four hundred. Days. Oh. My. God.
I’m glad we’re all still here! I can only imagine how the people of March 9 2009 would have reacted if a Visitor From The Future (that would be you) announced to them that the market was going to start rising and it would go up at LEAST 3,453 days. I don’t think they would have believed you. Not even the Elliott Wave guys!
Oddly, I had a good day on Wednesday in both my regular portfolio (57 short positions) and my options account (just 1). Let’s see where indexes wound up, thanks to our friend SlopeCharts.
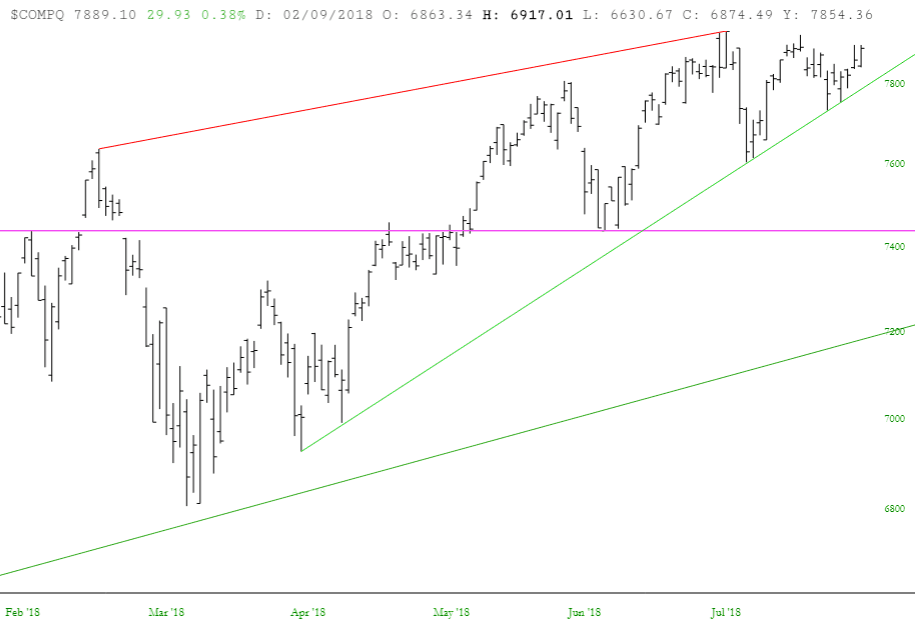
The NASDAQ Composite approached its lifetime high, and it certainly has plenty of room to roam on the upside. Everything about this chart says “higher.”
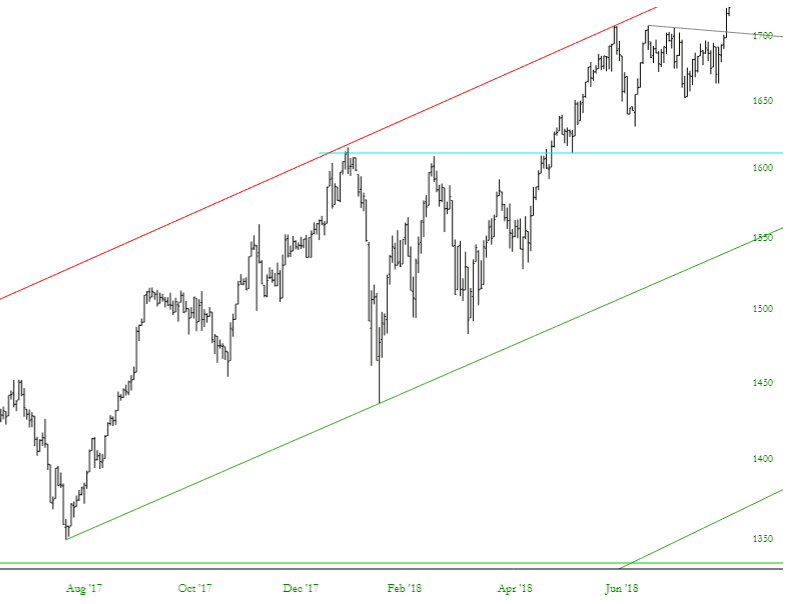
The Russell 2000 broke out above its small resistance trendline yesterday, and it added to those gains today. This line now represents support, and as with the chart above, there’s nothing but blue sky above: the small caps are higher than they have ever been since the creation of the Universe 13.8 billion years ago.
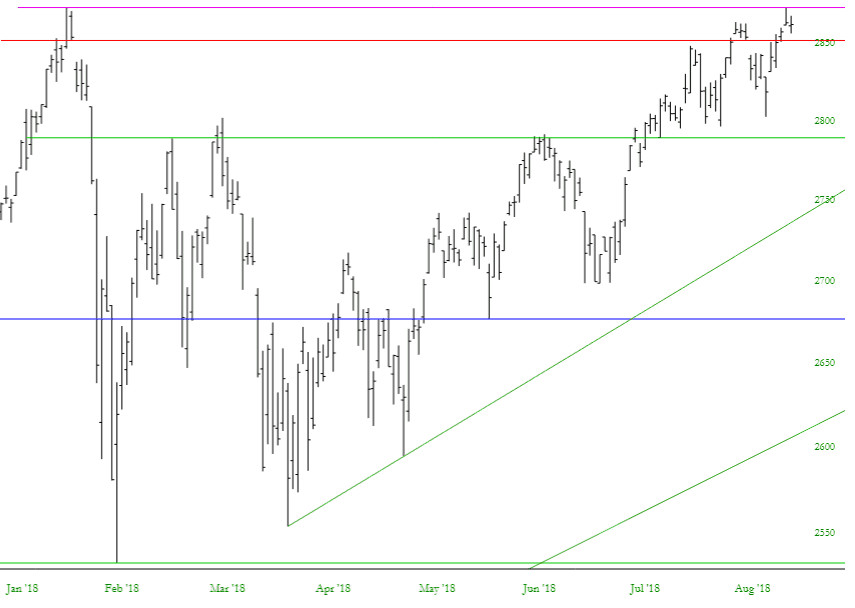
The S&P 500 isn’t in breakout mode yet, but it’s terribly close. That horizontal purple line is the key, and for this index (and the market in general) it would take some big, big, BIG news to wrench things from an uptrend to a downtrend. I’m not sure how big. Probably bigger than nuclear war. Maybe an imminent asteroid strike with a guaranteed extinction event.
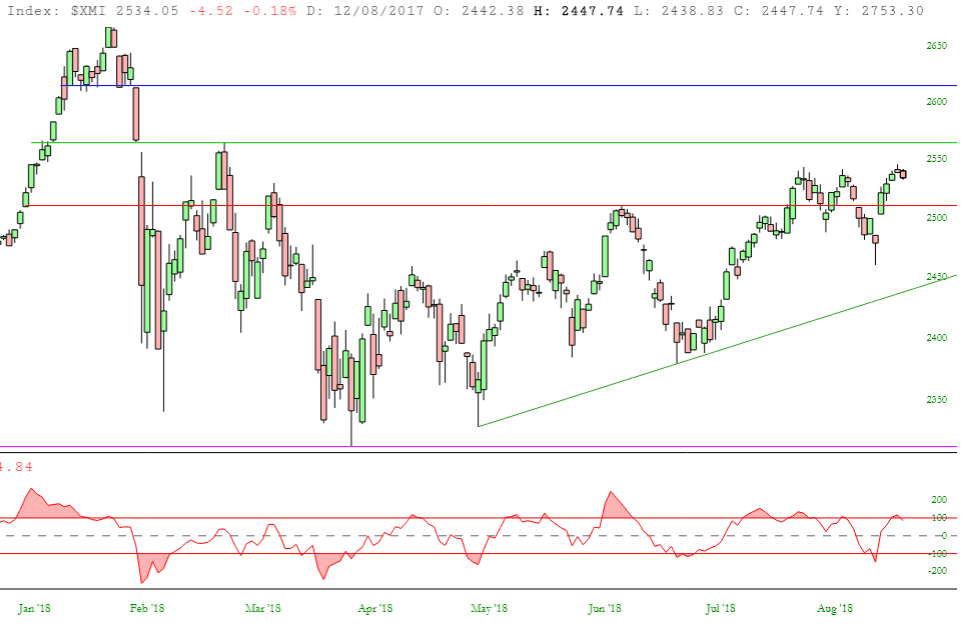
One of the few broad indexes that looks a bit squishy is the Major Market Index, whose CCI looks ready to slip lower.