An unsettled open on ES last night with more rumblings from Turkey and lower lows on ES and NQ. I was asked before the open whether I thought there was a serious risk of the wheels coming off on SPX with a 5% or so retracement directly from here, and I replied that I thought that the risk was low, though possible as always.
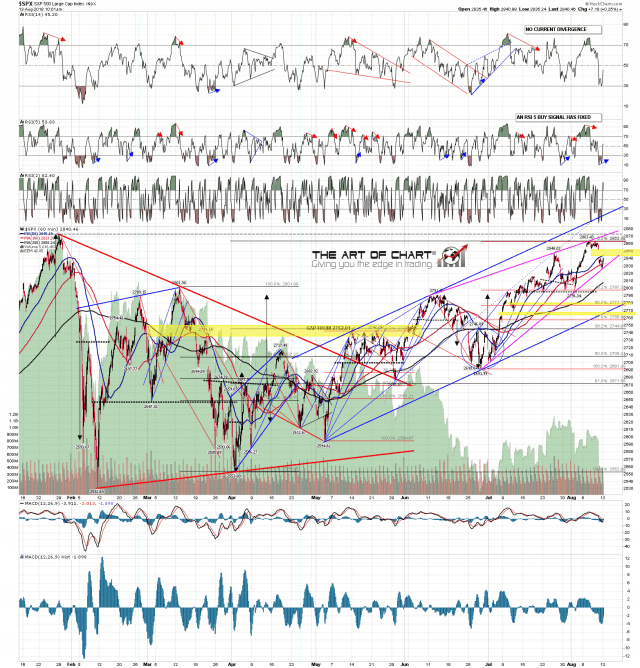
There are four important support levels below, all shown on the SPX 60min chart. The first is the short term rising wedge support trendline at Friday’s low, supported by the daily middle band. As long as that holds the obvious next target is wedge resistance in the 2870 area. If that should break then there is strong established support in the 2800 area, which would also be the 38.2% retracement of the rising wedge. If 2800 was to break that could be a significant bearish break, but there would still be main channel support, currently in the 2765 area.
On the upside resistance is at the the ES weekly pivot at 2842 and the 50 hour MA on SPX, currently at 2845 and resistance so far both on Friday and today, then the open gap from 2853.58 that would need to be filled. After that the way would be clear for SPX to head back to short term wedge resistance and a likely test of the all time high at 2872.87.
Leaning long into that ATH retest until demonstrated otherwise.
Partial Premarket Video from theartofchart.net – Update on ES, NQ:
SPX 60min chart:
We did our monthly public Chart Chat yesterday, and the recording for that is posted on our August Free Webinars page. We are doing our monthly free public FAANG & Key Sectors webinar after the close on Thursday, and if you’d like to see that, you can register on the same page.


