Wow, this is just sad to see. Honestly. If you have any interest in the old Saturday Night Live, Chevy Chase, or – – frankly – – what it’s like to be disappointed in your autumn years – – just watch this.
Slope of Hope Blog Posts
Slope initially began as a blog, so this is where most of the website’s content resides. Here we have tens of thousands of posts dating back over a decade. These are listed in reverse chronological order. Click on any category icon below to see posts tagged with that particular subject, or click on a word in the category cloud on the right side of the screen for more specific choices.
Regards to Emerging
As suggested late last week, the emerging markets (EEM) has done a U-turn precisely where it should have. My short positions and puts both say “thank you!”This market has been breathtakingly consistent all of 2018.

I Never Thought I’d Write to Slope, But……….
Three amusing things this morning.
First, ES and NQ are still red. Incredible. Horrific bad news can actually keep them down for more than a few hours. Color me amazed.
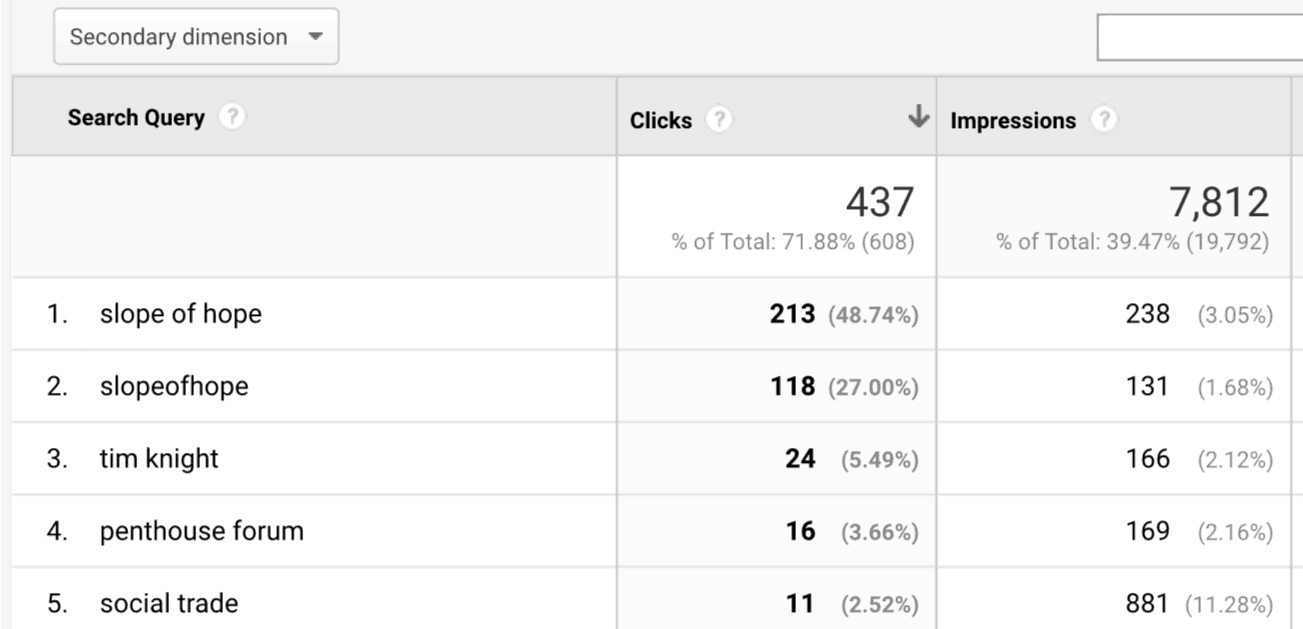
Two, I just started getting information from Google about what search terms people are using to find Slope. One of them top terms is, umm, surprising.
The Latest Salvo
So if the prospect of a relaxation in trade wars is worth 3,000 points on the Dow, then surely the total collapse of trade talks is worth – – what – – about 70 points or so? Anyway, as I type this on Sunday evening, the ES is down, getting slaughtered and vanquished to the tune of two-tenths of a single percentage point. It’s just like last weekend. A mountain of bad news resulting in a tiny downtick, all of which will be green by tomorrow, right?

More Options Ideas
Note from Tim: I’m pleased to present another options trade ideas offering from Slope’s own The Director! Behind the scenes, we are beefing up the Diamond membership to encompass tools for options traders, and we’re whetting appetites out there with posts like these. Enjoy.
Outside of earnings ideas, here are some ideas based on edges in the field.
The Bollinger Band
The Bollinger band is a graphical standard deviation range away from the 21 day moving average developed by John Bollinger. The TTM squeeze is a proprietary indicator developed by John Carter that describes a state that where the Bollinger band is in a compressed, low volatility state.
When charts are in a lowered volatility state, they have an increased probability of a larger move in a specified direction. One can discern a higher probability of a certain direction using either the value and /or slope of simple momentum, or an increasing slope of the relative strength indicator (RSI), or the use of the Williams accumulation/distribution index’s slope diverging from the price. (more…)
